Human IL-15 ELISA Kit, High Sensitivity (Serum, Plasma, TCM)
Catalog Number: 41702
The Human Interleukin 15 ELISA measures endogenous human IL-15 at or near basal levels with LLOQ of 0.51 pg/ml in serum, plasma, and cell culture media. This ELISA detects both free and bound forms of IL-15 (IL-15/IL-15R complex).
Product Name: VeriKine-HS Human Interleukin 15 ELISA Kit
$655.00
Product Info
| Matrix Compatibility | Serum, Plasma, Tissue Culture Media |
|---|---|
| Assay Range | 0.51 - 32.8 pg/ml |
| LLOQ |
0.51 pg/ml Need more sensitivity? Check out our Sample Testing Services |
| Assay Length | 4 hours |
| Specificity | Human Interleukin 15 |
| CVs |
Inter-Assay: < 10%
|
This ELISA measures IL-15 in tissue culture media (TCM), serum and plasma. It measures both IL-15 alone and IL-15/IL-15Rα complexes and quantitates IL-15 in healthy donor matrices. This assay’s standard is the IL-15 receptor heterodimer, but the standard curve is calibrated to the IL-15 portion of the complex since the antibodies used are IL-15 specific.
This kit quantitates free human IL-15 and bound IL-15/IL-15R in serum, plasma and TCM using a sandwich immunoassay. The kit is based on an ELISA with biotinylated-detection antibody and streptavidin-conjugated horseradish peroxidase (HRP). Tetramethyl-benzidine (TMB) is the substrate.
Specifications
| CVs and Spike Recovery |
Inter-Assay: < 10%
|
|---|---|
| Cross-reactivity |
No cross-reactivity detected with
|
| Storage | 2-8 °C |
| Expiration Date | One year from the date of manufacture |
| Shipping Condition | Wet Ice |
Materials Provided
- Pre-Coated Micro-Titer Stripwell Plate/Sealers
- Wash Solution Concentrate
- Human Interleukin-15 Standard (410 pg/ml)
- Assay Buffer
- Dilution Buffer
- Antibody Concentrate
- HRP Conjugate Concentrate
- Concentrate Diluent
- HRP Diluent
- TMB Substrate Solution
- Stop Solution
Additional Materials Required (Not Provided)
- Microplate reader capable of reading an OD at a wavelength of 450 nm
- Variable volume microtiter pipettes
- Adjustable multichannel pipette (50-300 μl)
- Reagent reservoirs
- Wash bottle or plate washing system
- Distilled or deionized water
- Serological pipettes (1, 5, 10 or 25 ml)
- Disposable pipette tips (polypropylene)
- Plate shaker
Tech Info & Data
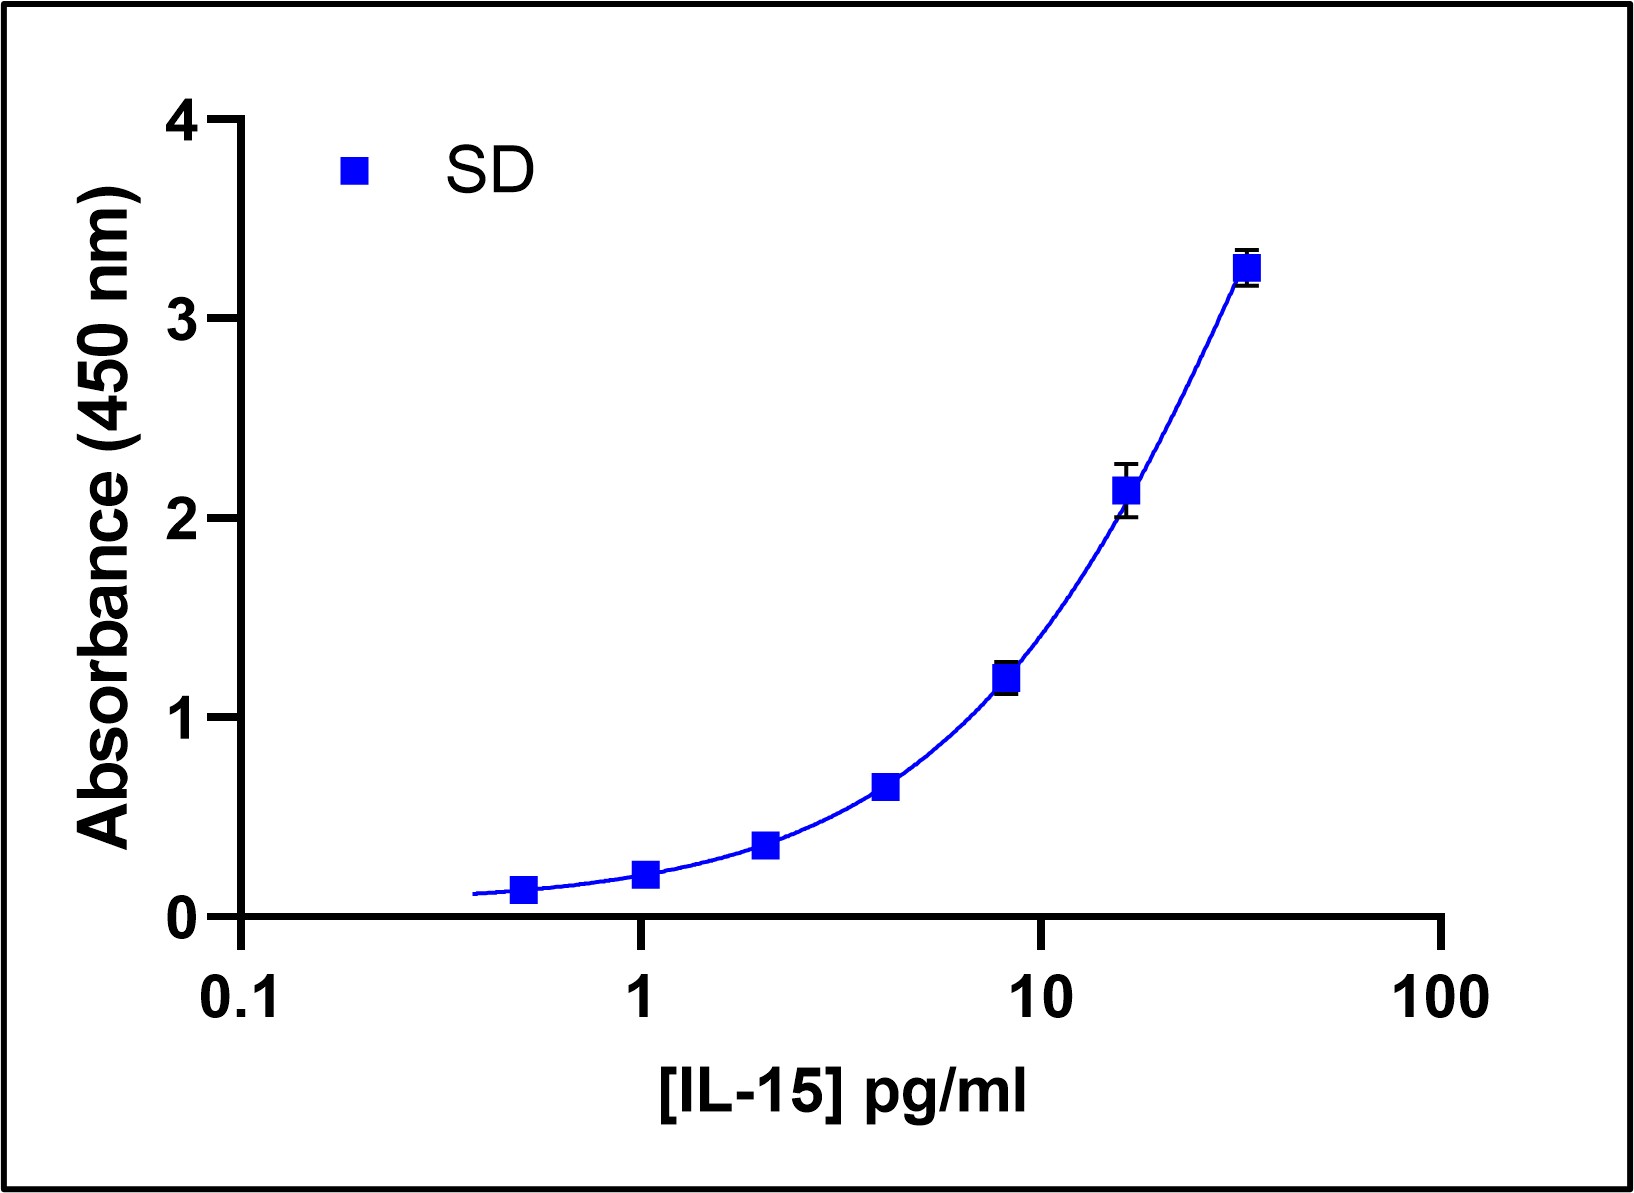
Representative Standard Curve in Standard Diluent
Intra-Assay Precision |
||||||
| Sample | 1 | 2 | 3 | 4 | 5 | 6 |
|---|---|---|---|---|---|---|
| n | 26 | 26 | 26 | 26 | 26 | 26 |
| Mean (pg/ml) | 4.17 | 4.42 | 4.20 | 2.81 | 3.85 | 3.87 |
| Std. Dev. | 0.18 | 0.09 | 0.18 | 0.10 | 0.13 | 0.13 |
| CV (%) | 4.4 | 1.9 | 4.3 | 3.6 | 3.3 | 3.3 |
Inter-Assay Precision |
|||||||
| Sample | 1 | 2 | 3 | 4 | 5 | 6 | 7 |
|---|---|---|---|---|---|---|---|
| Mean (pg/ml) | 4.52 | 3.55 | 4.47 | 2.87 | 3.54 | 12.55 | 3.68 |
| Std. Dev. | 0.24 | 0.16 | 0.17 | 0.16 | 0.19 | 0.61 | 0.13 |
| CV (%) | 5.3 | 4.6 | 3.7 | 5.4 | 5.4 | 4.8 | 3.4 |
Inter-Batch Precision |
|||||||
| Sample | 1 | 2 | 3 | 4 | 5 | 6 | 7 |
|---|---|---|---|---|---|---|---|
| Lot 1 (pg/ml) | 5.26 | 3.97 | 5.12 | 3.24 | 4.02 | 13.94 | 4.18 |
| Lot 2 (pg/ml) | 5.16 | 3.94 | 5.09 | 3.20 | 3.97 | 13.58 | 4.26 |
| Lot 3 (pg/ml) | 4.80 | 3.62 | 4.71 | 2.85 | 3.66 | 12.77 | 3.86 |
| Mean (pg/ml) | 5.07 | 3.84 | 4.97 | 3.10 | 3.88 | 13.43 | 4.10 |
| Std. Dev. | 0.24 | 0.19 | 0.22 | 0.21 | 0.20 | 0.60 | 0.21 |
| CV(%) | 4.7 | 5.0 | 4.5 | 6.8 | 5.1 | 4.5 | 5.1 |
Intermediate Precision |
|||||||
| Sample | 1 | 2 | 3 | 4 | 5 | 6 | 7 |
|---|---|---|---|---|---|---|---|
| n | 27 | 27 | 27 | 27 | 27 | 27 | 27 |
| Mean (pg/ml) | 5.07 | 3.84 | 4.97 | 3.10 | 3.88 | 13.43 | 4.05 |
| Std. Dev. | 0.63 | 0.49 | 0.57 | 0.38 | 0.45 | 1.30 | 0.40 |
| CV (%) | 12.5 | 12.9 | 11.5 | 12.4 | 11.6 | 9.7 |
9.9 |
Spike Recovery
|
TCM |
|||
| Spike Sample | 1 | 2 | 3 |
|---|---|---|---|
| Target Conc. (pg/ml) | 24.61 | 6.15 | 0.82 |
| Mean Recovery | 92.8 | 97.0 | 94.0 |
| Range (%) | 91.5 – 95.1 | 93.3 – 99.0 | 93.5 – 94.5 |
|
Disodium-EDTA Plasma |
|||
| Spike Sample | 1 | 2 | 3 |
| Target Conc. (pg/ml) | 24.61 | 6.15 | 0.82 |
| Mean Recovery | 98.1 | 99.9 | 82.1 |
| Range (%) | 78.4 – 104.5 | 85.1 – 108.1 | 64.9 – 95.3 |
|
Serum |
|||
| Spike Sample | 1 | 2 | 3 |
| Target Conc. (pg/ml) | 24.61 | 6.15 | 0.82 |
| Mean Recovery | 99.2 | 94.7 | 75.6 |
| Range (%) | 99.2 | 94.7 | 75.6 |
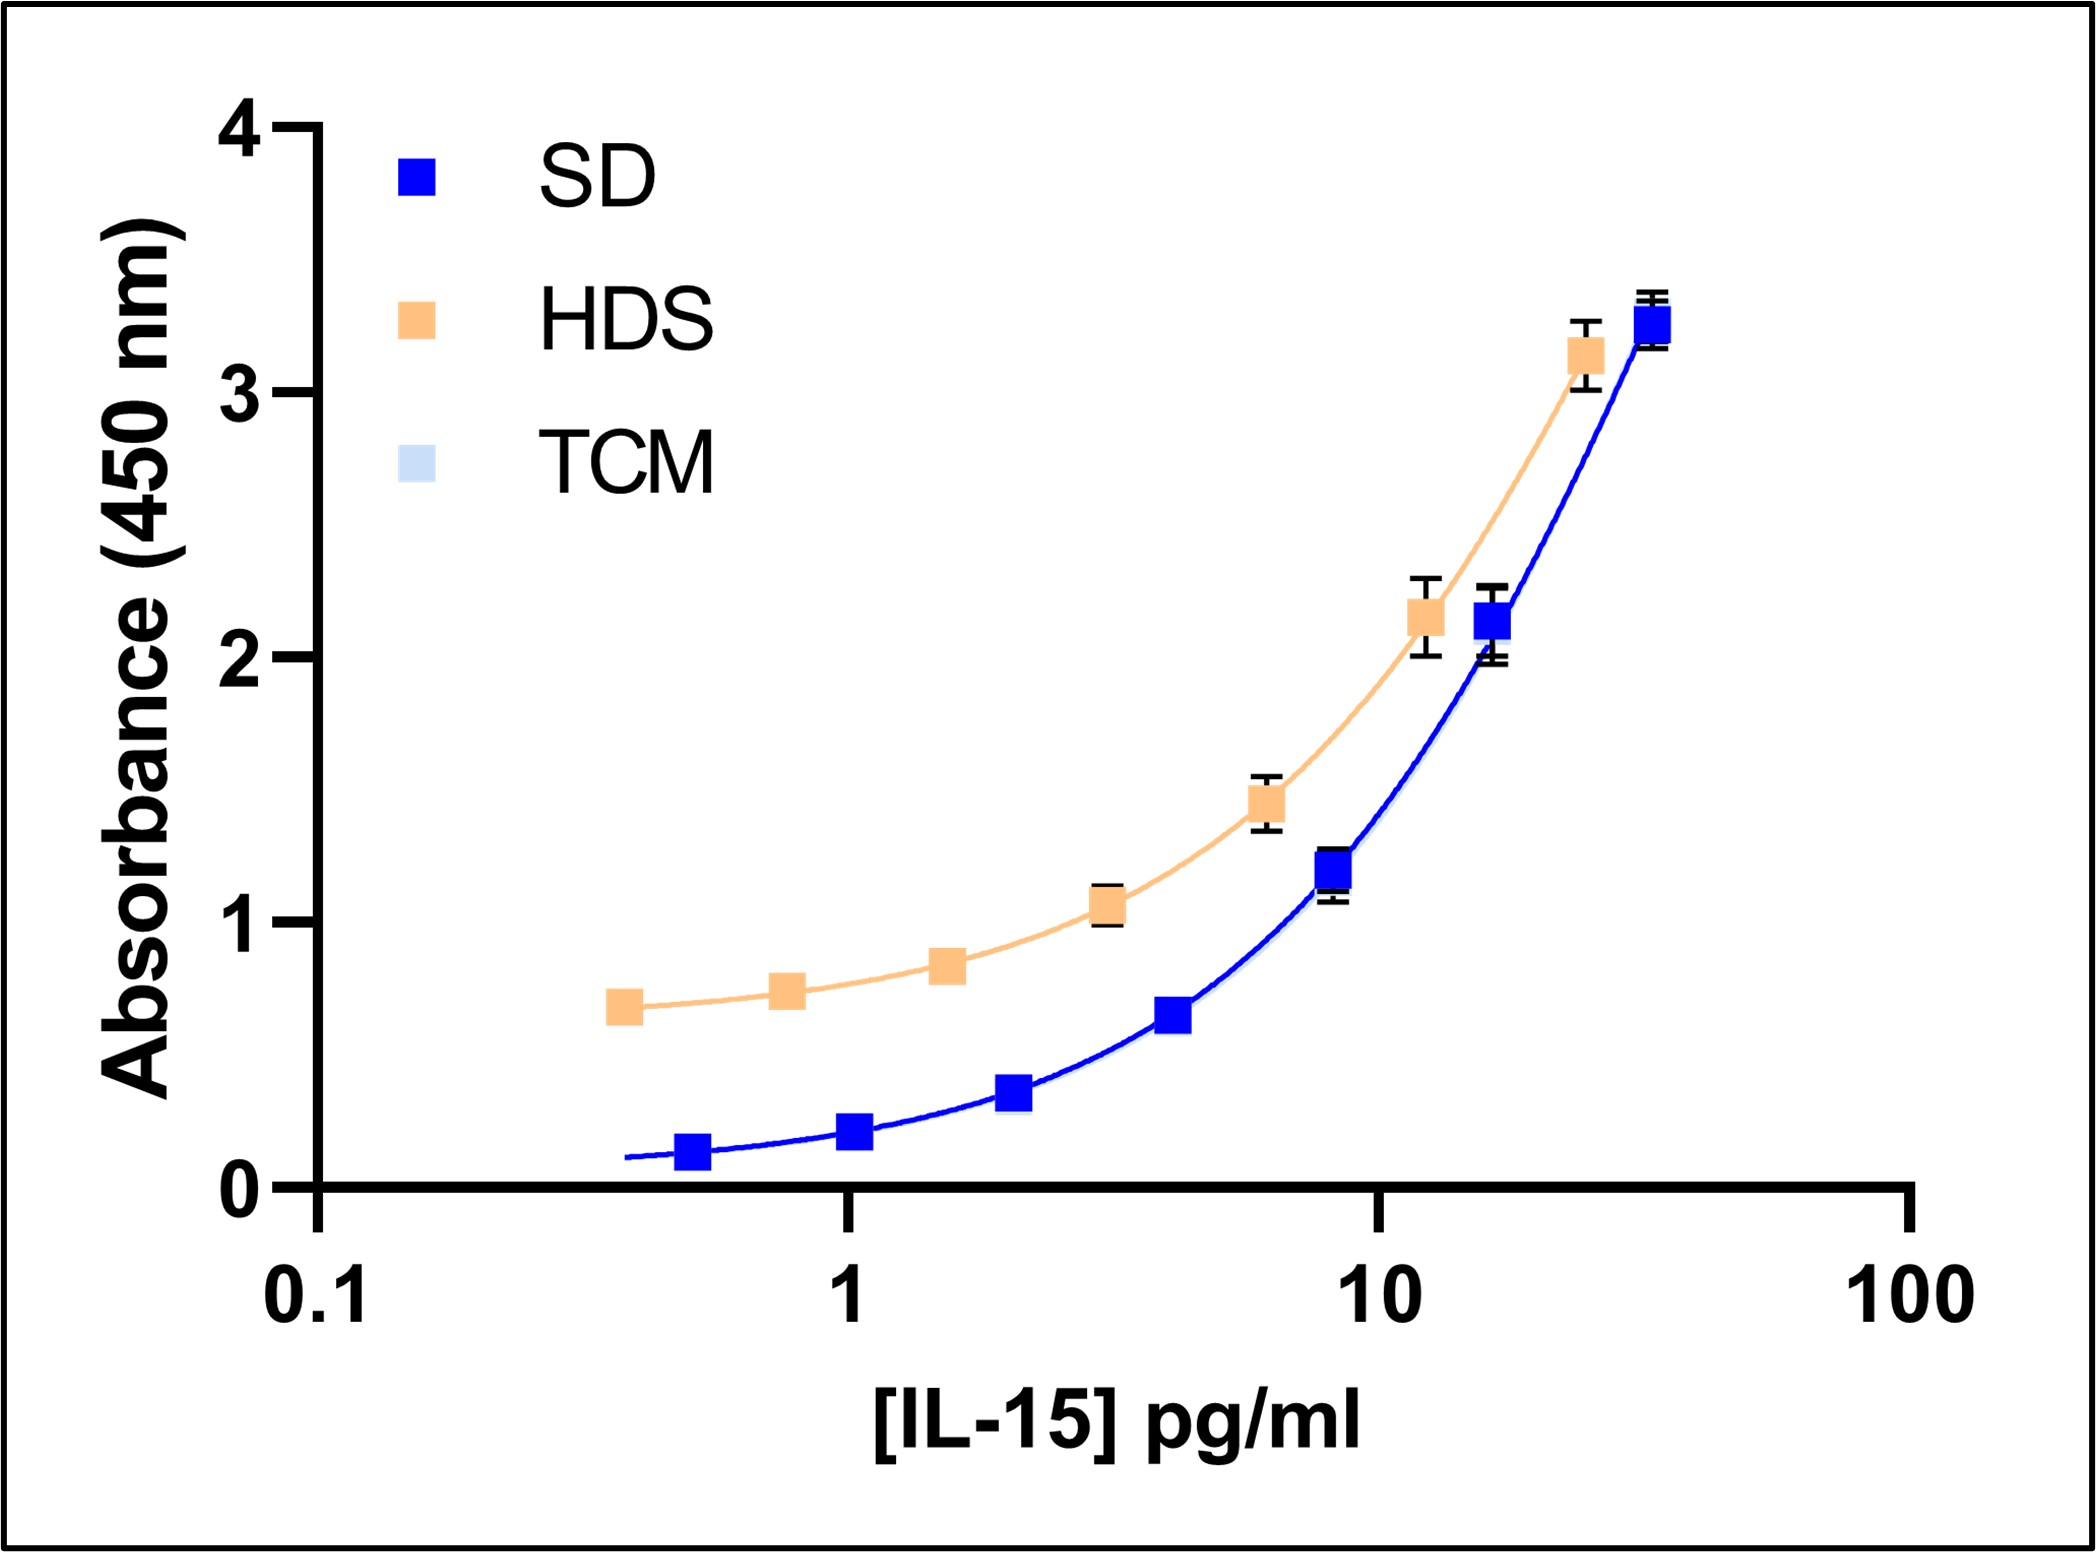
Representative Standard Curves in Various Matrices
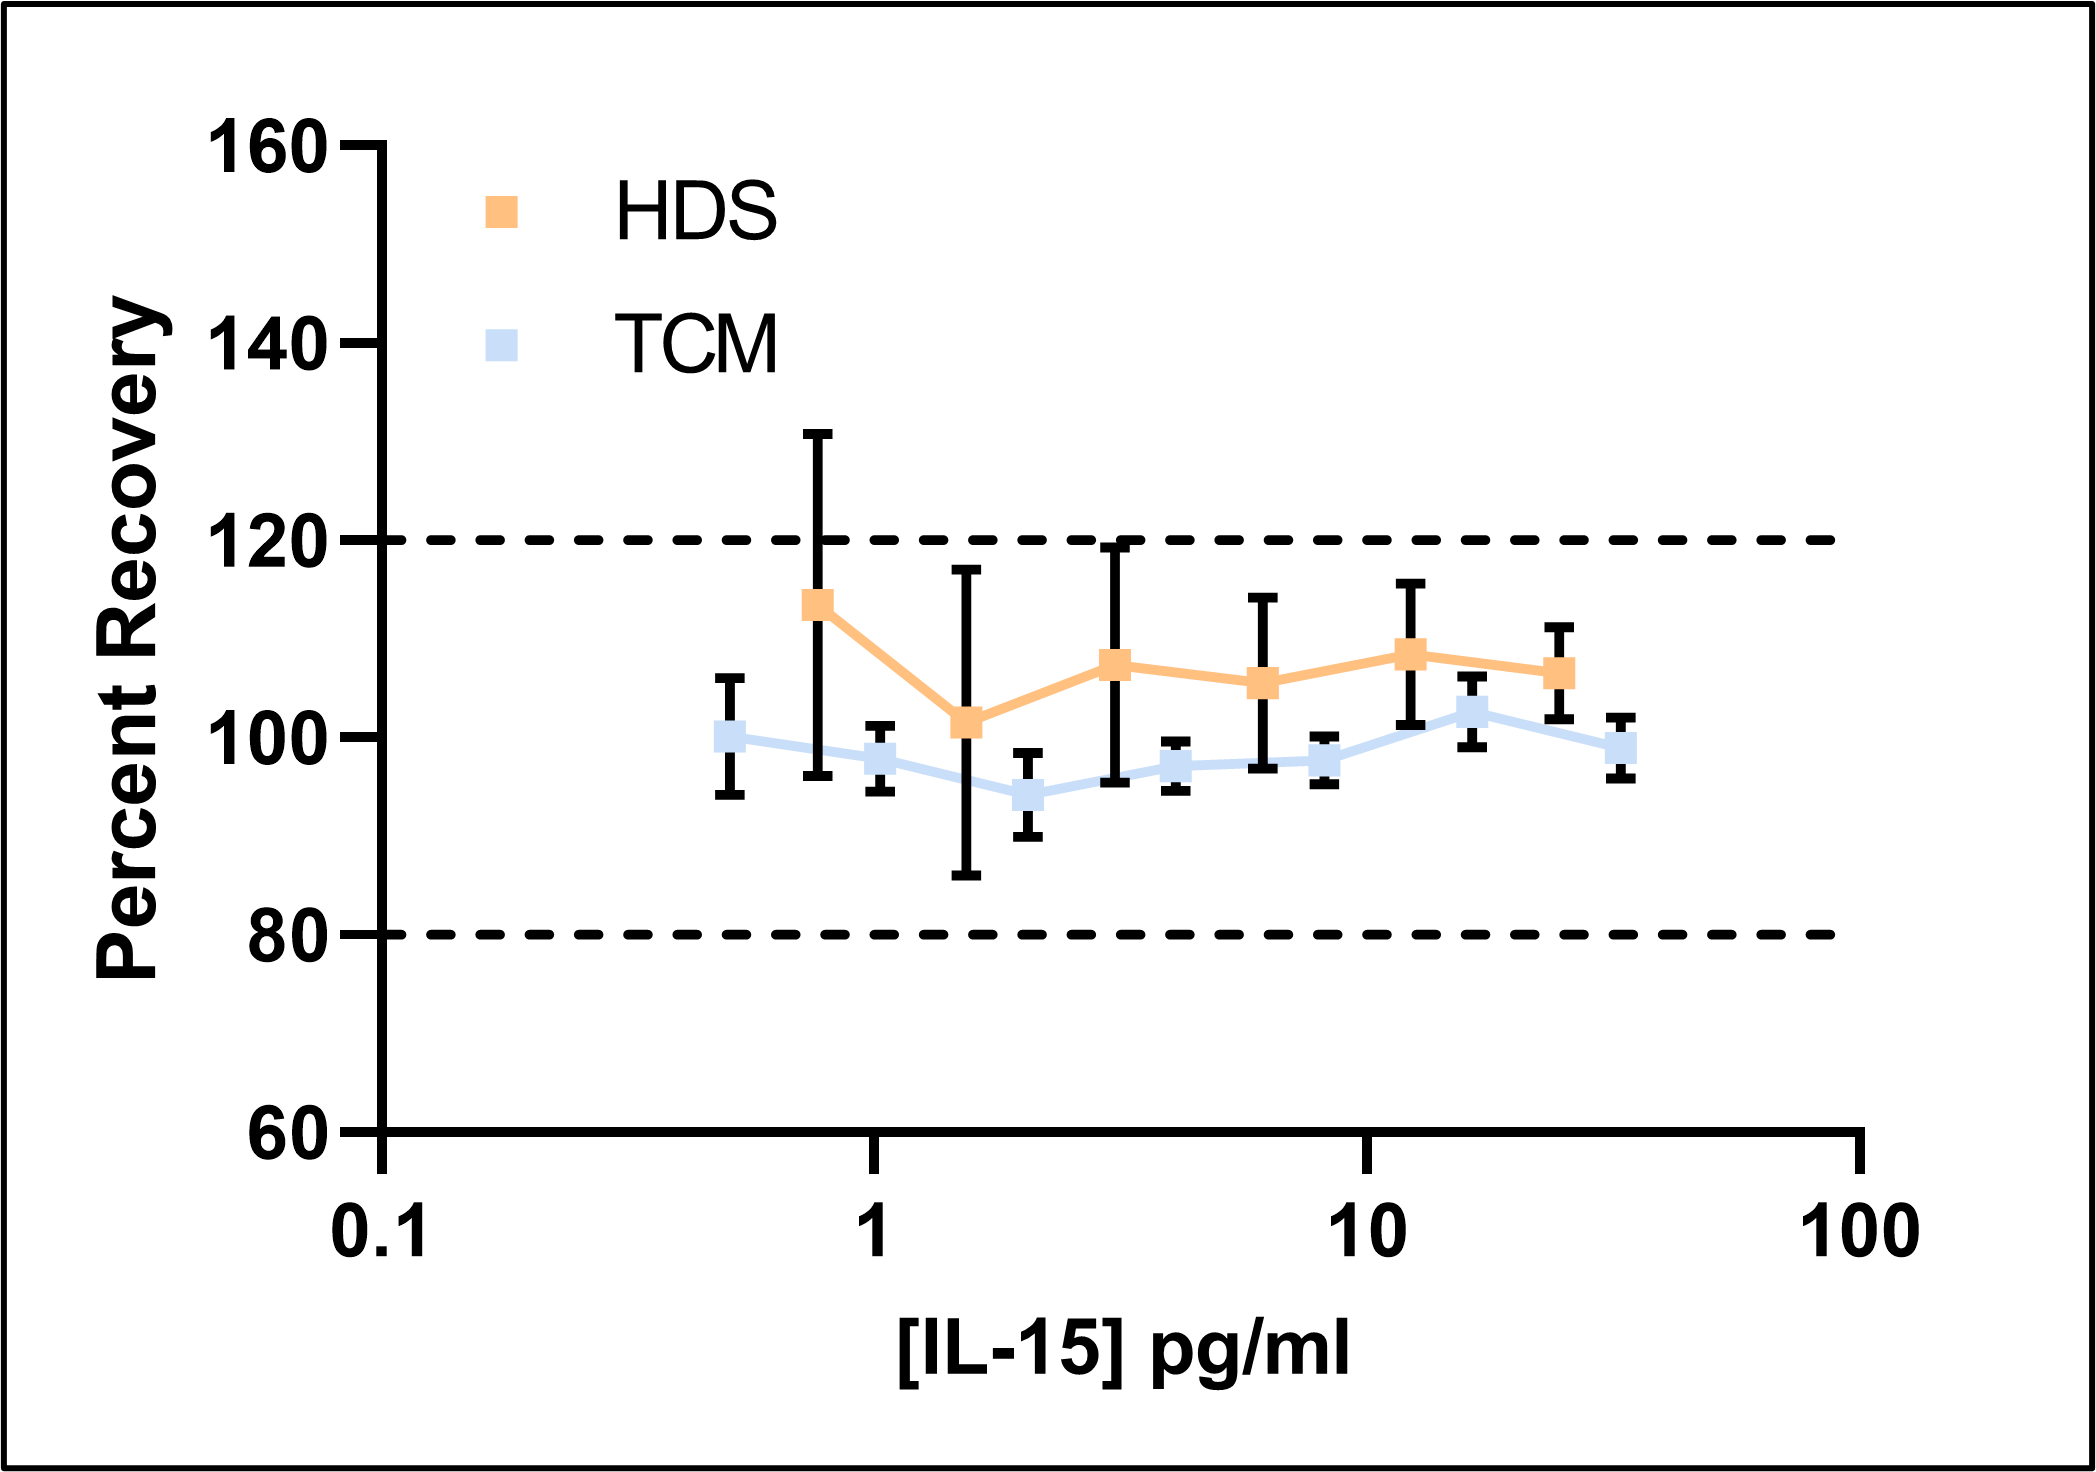
Percent Recovery of IL-15 in Various Matrices
MDD/LOQ |
|||
| Assay | 1 | 2 | 3 |
|---|---|---|---|
| n | 80 | 80 | 80 |
| Mean Blank (A450) | 0.055 | 0.052 | 0.057 |
| Std. Dev. | 0.004 | 0.007 | 0.008 |
| MDD (A450) | 0.067 | 0.072 | 0.079 |
| MDD (pg/ml) | 0.104 | 0.173 | 0.175 |
| LOQ (Abs450) | 0.096 | 0.121 | 0.132 |
| LOQ (pg/ml) | 0.341 | 0.571 | 0.575 |
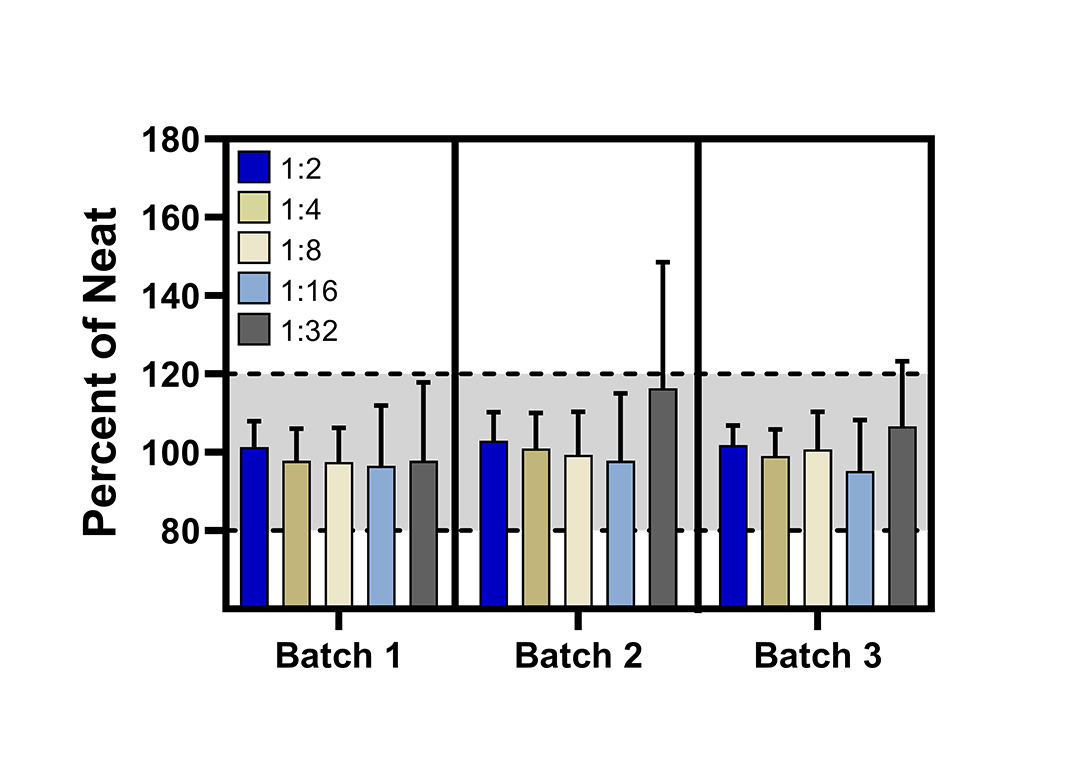
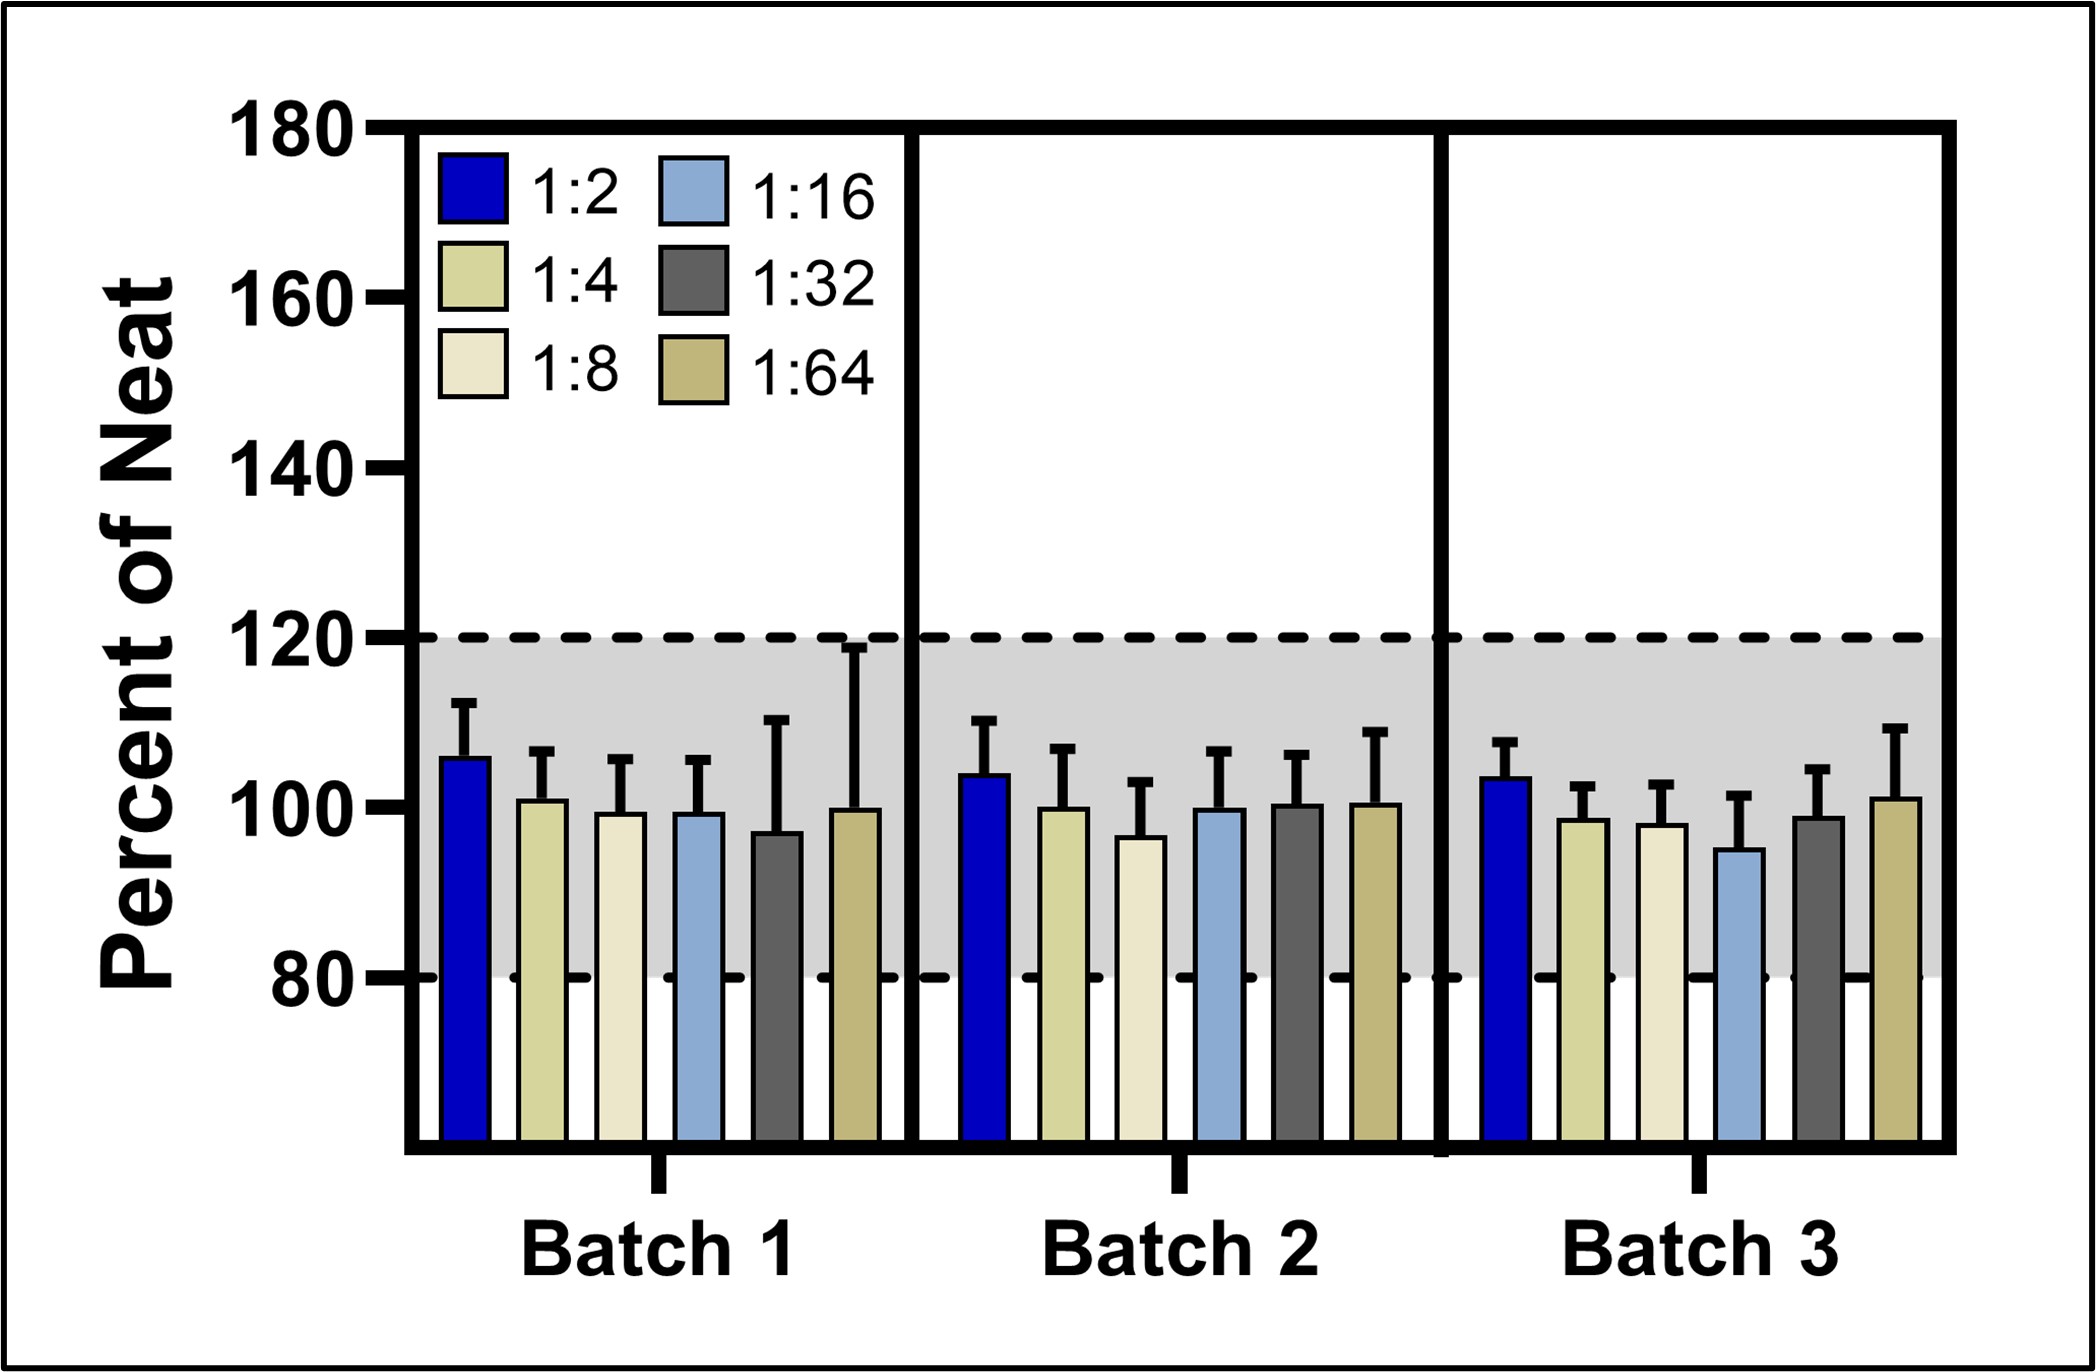
Linearity in Pooled Healthy Donor Serum (HDS)
Linearity in Tissue Culture Media (TCM)
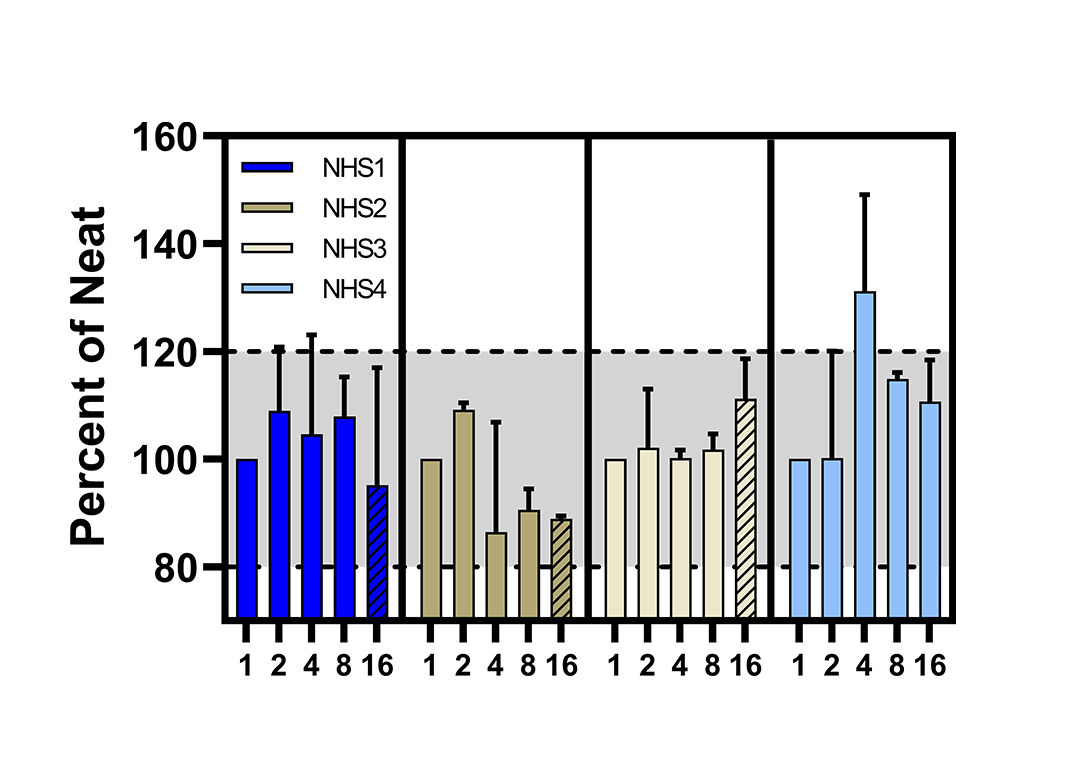
Parallelism in Individual Healthy Donor Sera (HDS)
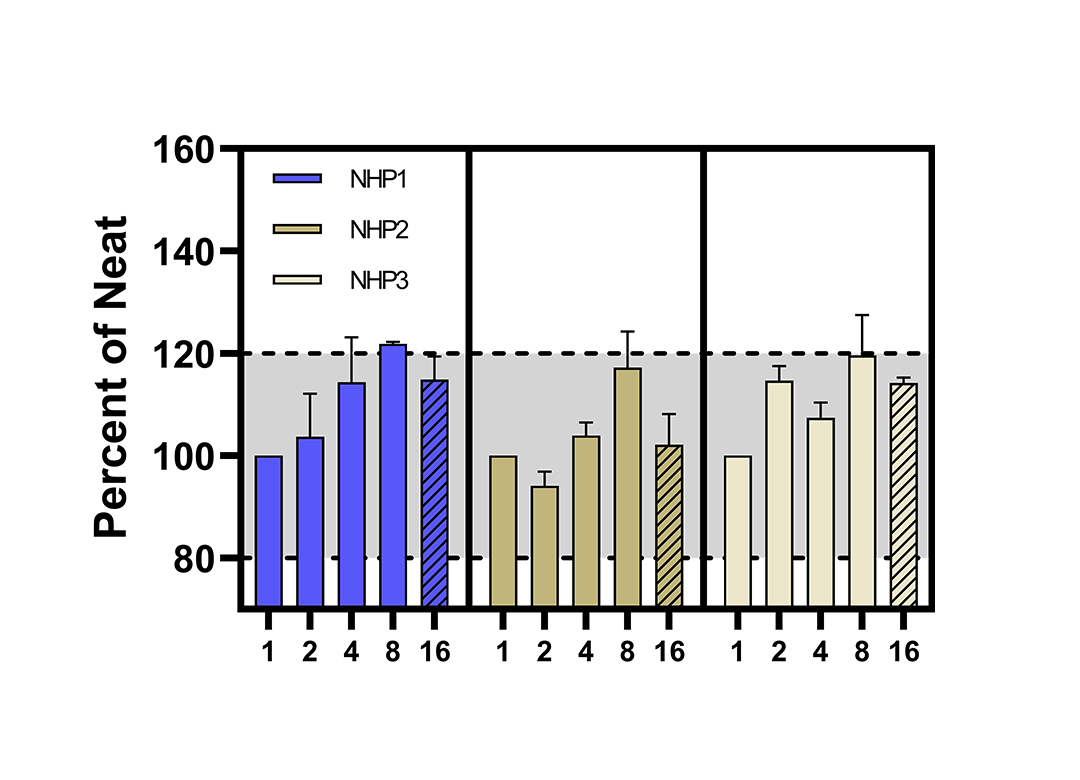
Parallelism in Healthy Donor Plasma (HDP)
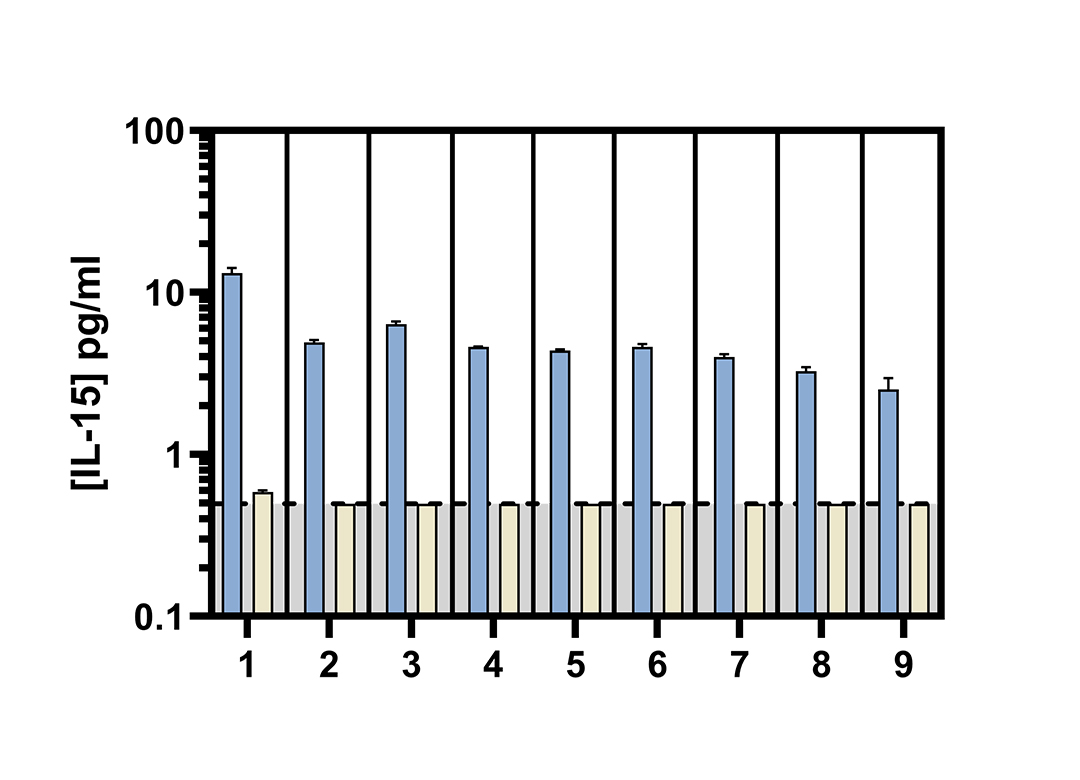
IL-15 Knockout under Control (Blue) and Specific (Beige) Conditions
IL-15 Concentrations under Knockout Conditions in HDS and HDP Samples |
|||
| Sample | [IL-15] pg/ml Control | [IL-15] pg/ml Specific | [IL-15] pg/ml Isotype |
|---|---|---|---|
| 1 | 13.12 | 0.59 | 6.99 |
| 2 | 4.92 | <LOQ | 4.4 |
| 3 | 6.38 | <LOQ | 3.87 |
| 4 | 4.61 | <LOQ | 4.66 |
| 5 | 4.38 | <LOQ | 4.55 |
| 6 | 4.61 | <LOQ | 4.66 |
| 7 | 3.98 | <LOQ | 3.51 |
| 8 | 3.27 | <LOQ | 2.95 |
| 9 | 2.52 | <LOQ |
2.46 |
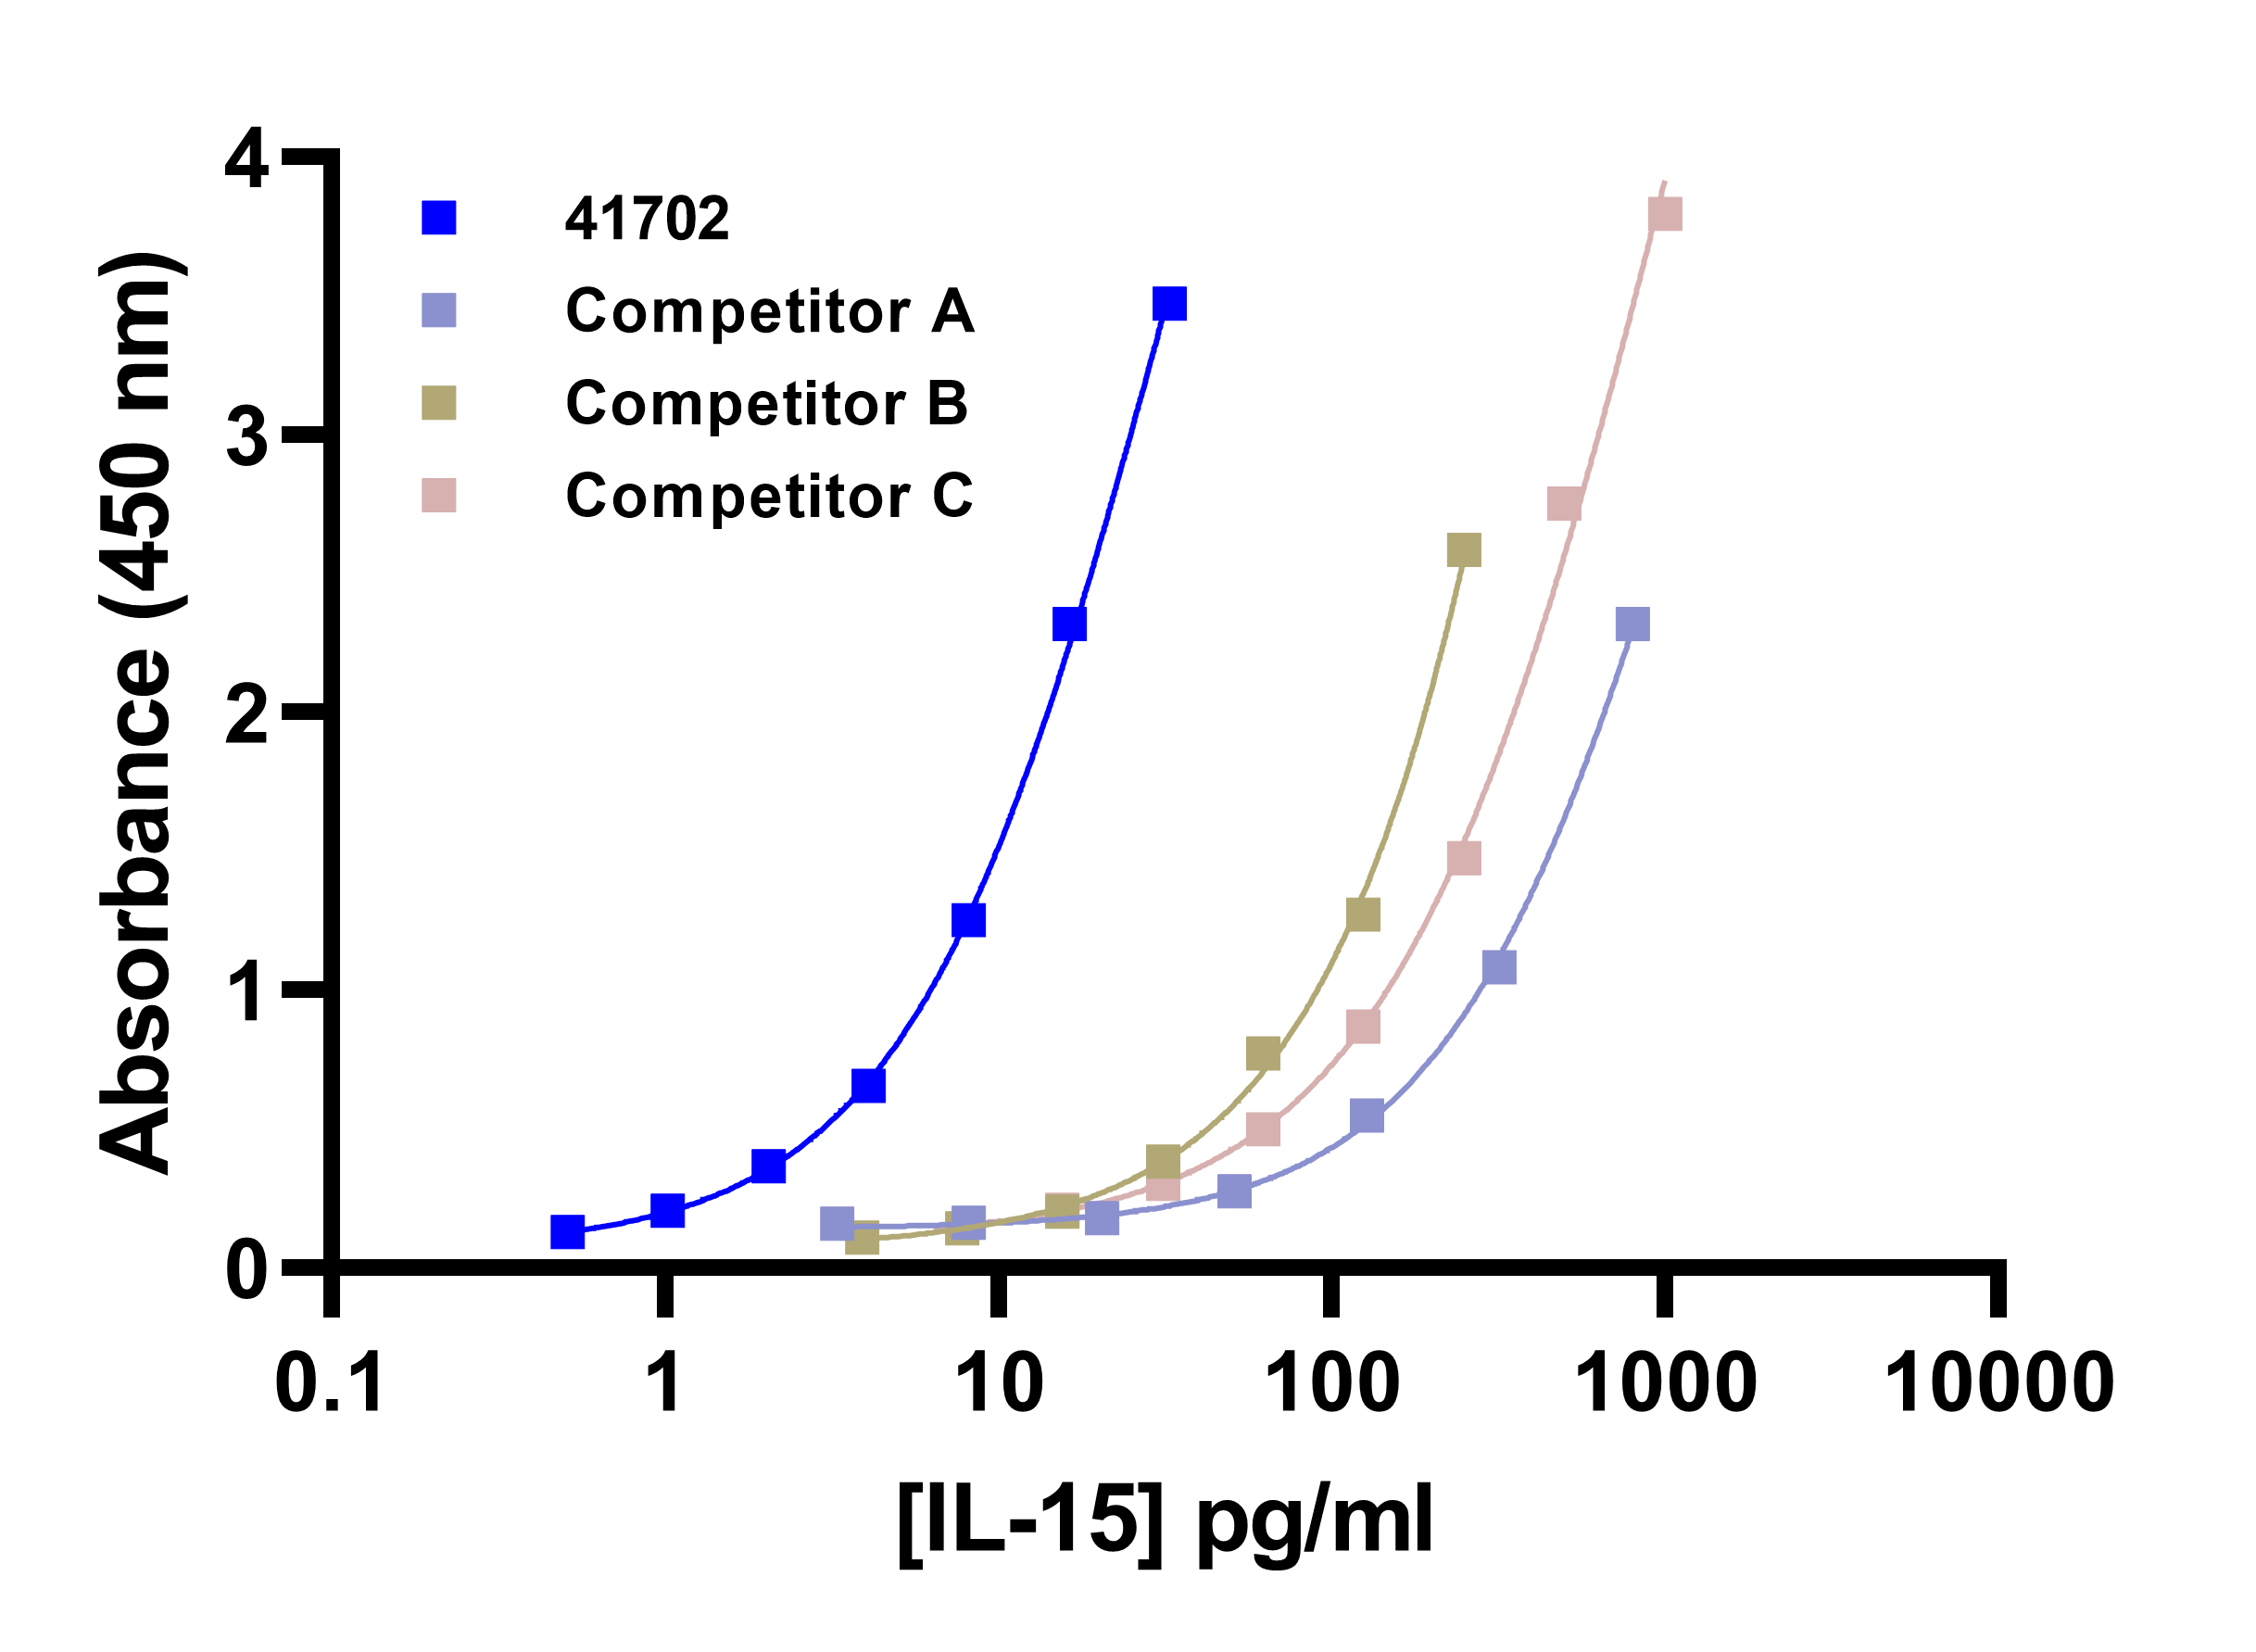
Representative Standard Curves on PBL’s IL-15 ELISA (41702) and Competitors
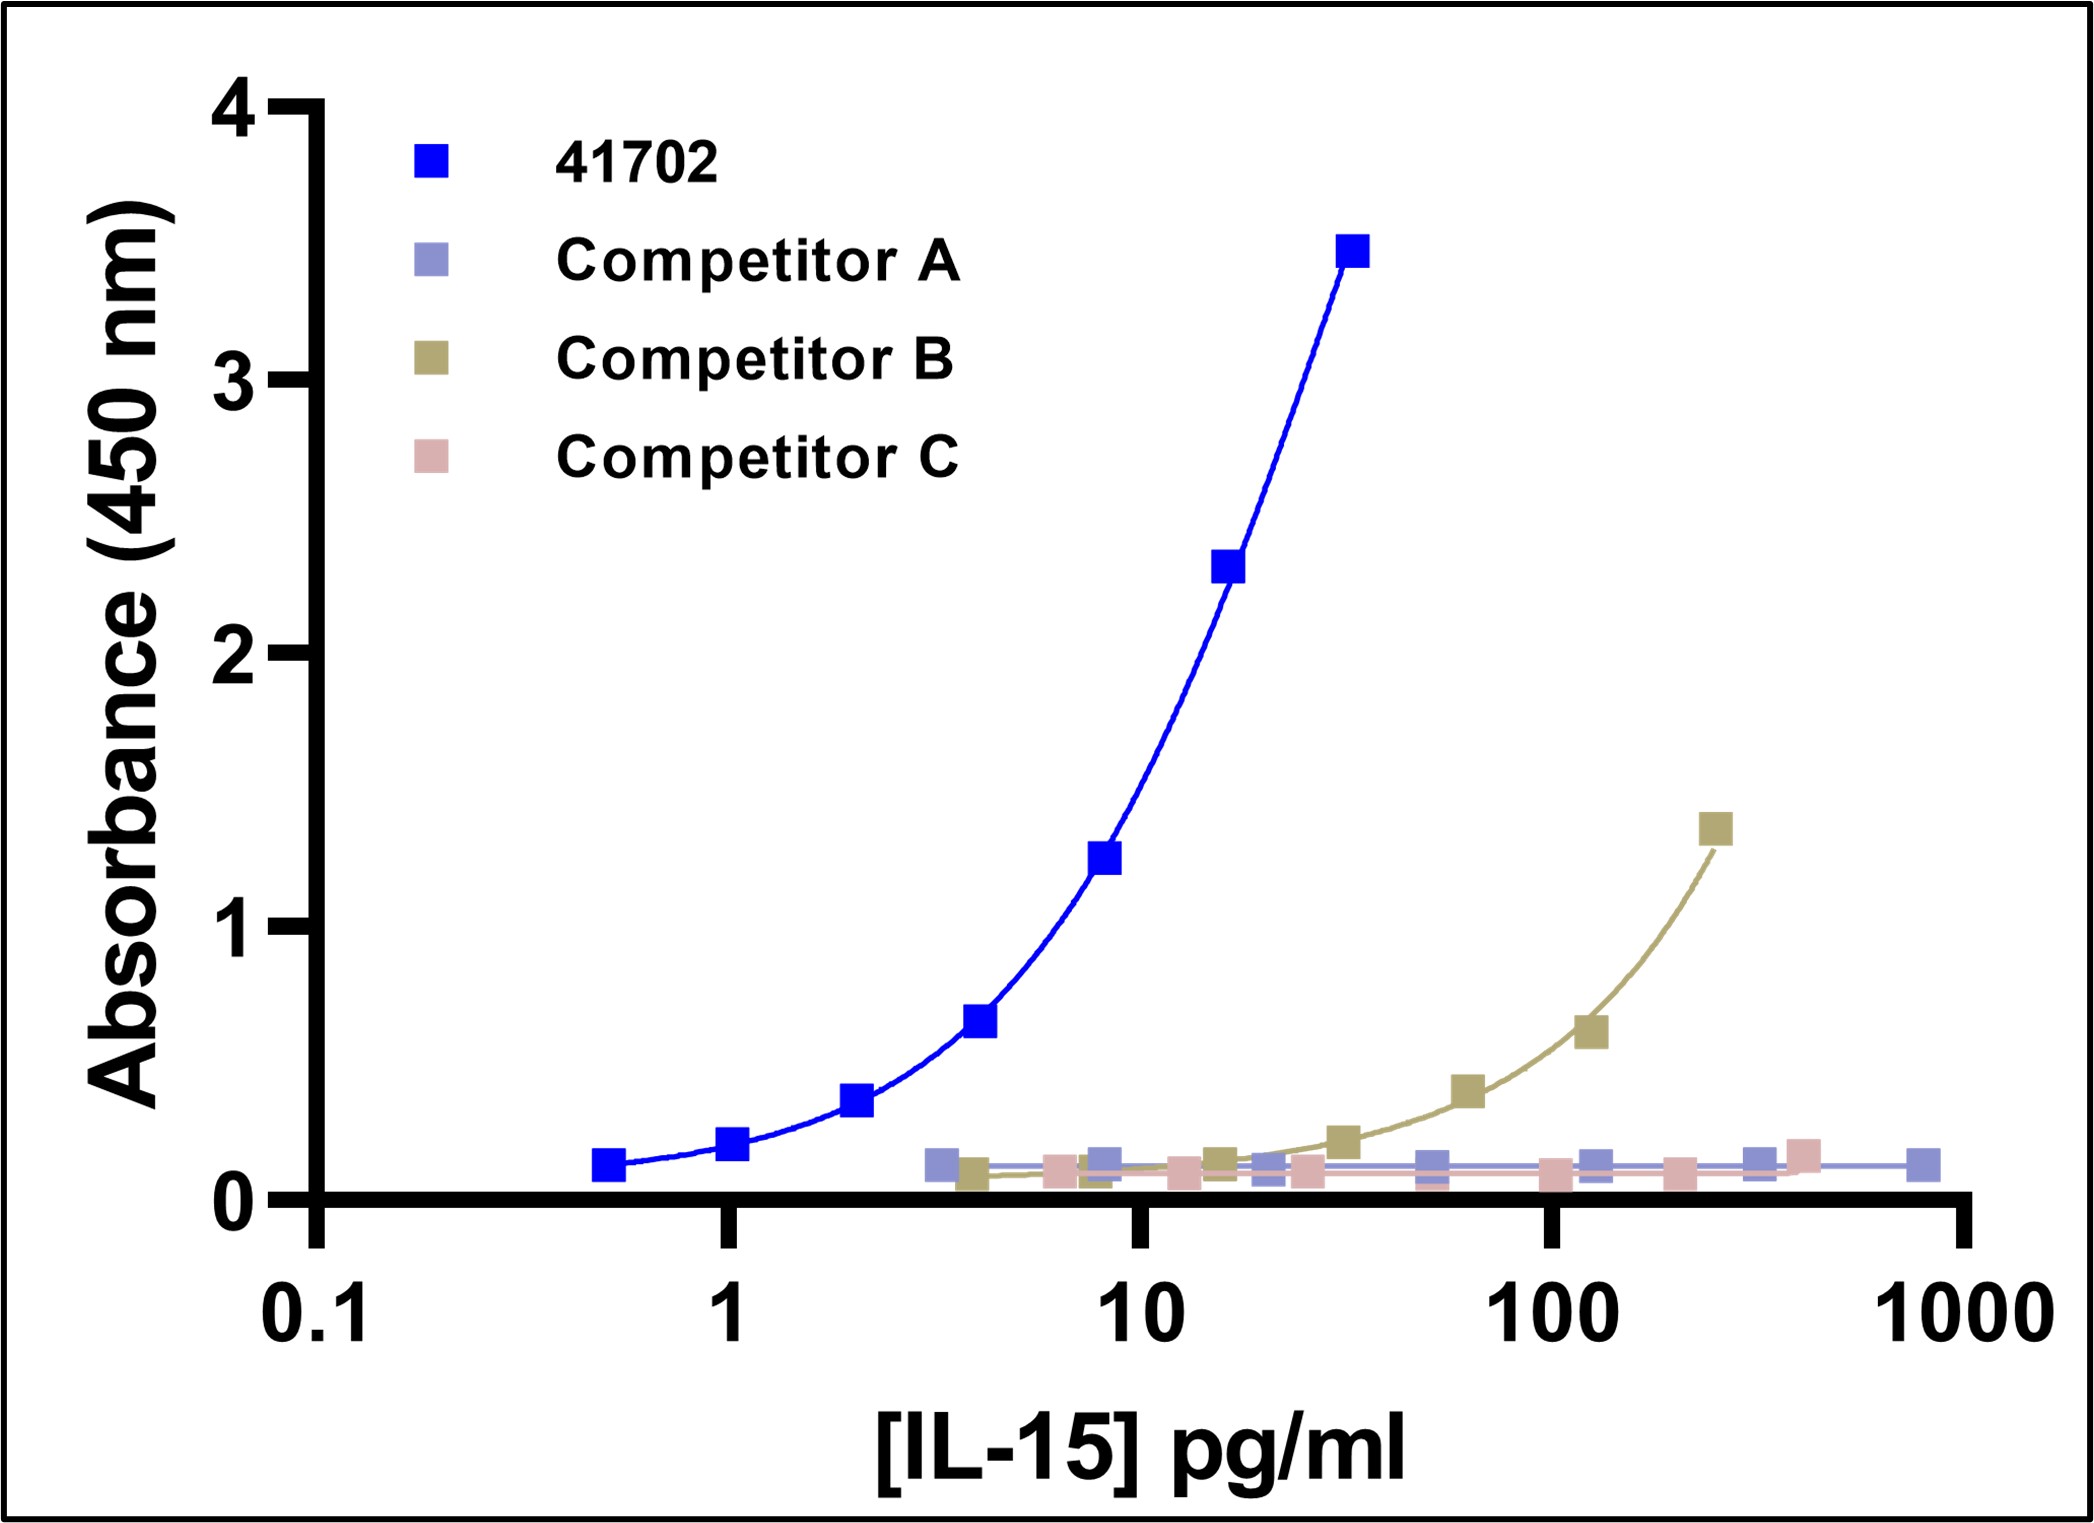
Comparison of PBL’s HEK Standard on Commercial ELISAs
Healthy Donor Readability Comparison |
|||||
| Sample Type | Quantifiable Mean (pg/ml) | Range (pg/ml) | % above LOQ | % below LOQ | %CV |
|---|---|---|---|---|---|
|
PBL's ELISA |
|||||
| Serum | 4.21 | 2.64– 13.75 | 100 (30/30) |
0 (0/30) |
3.0 |
| EDTA Plasma | 3.01 | 1.75– 4.17 |
100 (17/17) |
0 (0/17) |
2.4 |
| Citrate Plasma | 2.42 | 1.41– 3.99 |
100 (13/13) |
0 (0/13) |
3.1 |
| Heparin Plasma | 2.63 | 1.62– 3.87 |
100 (13/13) |
0 (0/13) |
2.9 |
|
Competitor A's ELISA |
|||||
| Serum | 91.51 | 17.84– 244.51 |
30 (9/30) |
70 (21/30) |
30.1 |
| EDTA Plasma | 35.13 | 8.89– 126.25 |
47.1 (8/17) |
52.9 (9/17) |
10.7 |
| Citrate Plasma | 22.00 | 10.56– 38.40 |
46 (6/13) |
54 (7/13) |
14.7 |
| Heparin Plasma | 58.48 | 40.31-76.66 |
20 (2/10) |
80 (8/10) |
5.0 |
|
Competitor B's ELISA |
|||||
| Serum | 5.78 | 4.13– 8.11 |
10 (3/30) |
90 (27/30) |
6.1 |
| EDTA Plasma | 4.74 | N/A |
5.9 (1/17) |
94.1 (16/17) |
N/A |
| Citrate Plasma | N/A | N/A |
0 (0/13) |
100 (13/13) |
N/A |
| Heparin Plasma | N/A | N/A |
0 (0/10) |
100 (10/10) |
N/A |
|
Competitor C's ELISA |
|||||
| Serum | N/A | N/A |
0 (0/30) |
100 (30/30) |
N/A |
| EDTA Plasma | N/A | N/A |
0 (0/18) |
100 (18/18) |
N/A |
| Citrate Plasma | N/A | N/A |
0 (0/12) |
100 (12/12) |
N/A |
| Heparin Plasma | N/A | N/A |
100 (0/10) |
0 (10/10) |
N/A |
Background
Interleukin-15 (IL-15) is a member of the IL-2 family of cytokines which also includes IL-4, -7, -9 and -211,2,3. It has similar and unique functions compared to IL-2. Signaling by IL-15 can be through the cytokine alone, in complex with soluble IL-15RAlpha and transpresented bound to IL15RAlpha. It is produced largely by monocytic cells but also by dendritic cells, keratinocytes, fibroblasts, myocytes, and nerve cells. It seems to enhance the expansion of CD8 memory cells, NK and NK-T cells4. IL-15 plays a role in tumor biology and autoimmune diseases including psoriasis, rheumatoid arthritis, inflammatory bowel disease, celiac disease, alopecia areata, and systemic lupus erythematosus5,6.
Citations
1 Citation:
- Kumar, A. et al., (2023), "Intrinsic suppression of type I interferon production underlies the therapeutic efficacy of IL-15-producing natural killer cells in B-cell acute lymphoblastic leukemia", J. Immunother. Cancer, 11(5):e006649, PMID: 37217248, DOI: 10.1136/jitc-2022-006649 (link)
Background Literature:
- Liao W, Lin JX, Leonard WJ. IL-2 family cytokines: new insights into the complex roles of IL-2 as a broad regulator of T helper cell differentiation. Curr Opin Immunol. 2011;23(5):598-604. (link)
- Grabstein KH, et al. Cloning of a T cell growth factor that interacts with the beta chain of the interleukin-2 receptor. Science. 1994 May;264(5161):965-8. (link)
- Burton, JD, et al. A lymphokine, provisionally designated interleukin T and produced by a human adult T-cell leukemia line, stimulates T-cell proliferation and the induction of lymphokine-activated killer cells. PNAS. 1994;91:4935-4939. (link)
- Ring, AM, et al. Mechanistic and structural insight into the functional dichotomy between IL-2 and IL-15. Nat Immunol. 2012;13(12):1187-95. (link)
- Waldmann, TA. The biology of IL-15: implications for cancer therapy and the treatment of autoimmune disorders. J Investig Dermatol Symp Proc. 2013 Dec;16(1):S28-30. (link)
- Clark DN, et al. Cytokine inhibition as a strategy for treating systemic lupus erythematosus. Clin Immunol. 2013;148(3):335-43. (link)
