Introduction
ELISA assay is based on the binding of a target molecule (analyte/antigen) to antibodies which specifically recognize the target. The presence of an antigen-antibody complex is detected using a secondary enzyme-conjugated antibody. Detection is obtained by addition of a substrate which yields a quantifiable signal. Standard curves are prepared by performing a dilution series of a known concentration of the analyte using different sample diluents. The non-linear 4-parameter fits of the curves are then used to calculate the concentration of an unknown sample in the similar diluent. The analyte to be measured can be present in different diluents such as tissue culture media with serum, neat serum, neat plasma, and salt buffers. In cases wherein the analyte to be measured is in serum or plasma, interference in the assay may arise due to presence of serum proteins, heterophilic antibodies and/or clotting factors. This may lead to detection of false positives, false negatives, or high backgrounds. In this study, we show that by using PBL’s VeriKine Human Alpha Multi-Subtype Serum ELISA kit 41110, on an average greater than 70% of actual concentration of low concentrations of Human Interferon (IFN) Alpha, can be detected in human plasma. We also show that false positives and false negatives at low concentrations of IFN are not seen, and high signals for blanks are absent. Additionally, we demonstrate that standard curves (500-12.5 pg/ml) prepared in pooled plasma pre-diluted to 50% in sample diluent or 2 X standard curves (1000-25 pg/ml) in neat pooled plasma diluted post preparation in sample diluent to 500-12.5 pg/ml are not significantly different.
Methods and Analysis
Standard curves were prepared from 1000 pg/ml-25 pg/ml in Sample Diluent, 3 lots of normal human plasma in different anti-coagulants (Na-Citrate, Na-EDTA and Na-Heparin) and in pools of the three lots. Additionally, low (30 pg/ml), medium (300 pg/ml) and high (800 pg/ml) spikes were prepared in two different lots of normal human plasma. These two lots were not from the lots used in the pool. Following this, 50 μl of the standard was added to 50 μl of Sample Diluent on the plate provided in product 41110-1 Human Interferon Alpha Serum Sample Multi-Subtype ELISA Kit. The remaining steps of the ELISA were performed as per the kit protocol. In a separate assay, standard curves from 1000-25 pg/ml in pooled human plasma and standard curves from 500-12.5 pg/ml in 50% pooled human plasma in diluted in Sample Diluent were compared. In this assay, 50 μl of the standards in pooled human plasma (1000-25 pg/ml) were added to 50 μl of Sample Diluent on the plate and in case of standards in 50 % pooled plasma (500-12.5 pg/ml) 100 μl was directly loaded on the plate. After completion of each assay, the plate(s) were read at 450 nm on a Vmax plate reader (Molecular Devices Corporation, CA). The Mean OD @ 450nm on Y-axis was plotted against the actual concentration in pg/ml on X-axis for each curve. The curves were generated using non-linear 4-parameter fit, (Figures 1-5).
Based on the curve fit equation and the Mean OD value for the data point, the extrapolated concentrations (backfit concentrations) were determined for each data point. All data was analyzed using SoftMax Pro version 5 (Molecular Devices Corporation, CA).
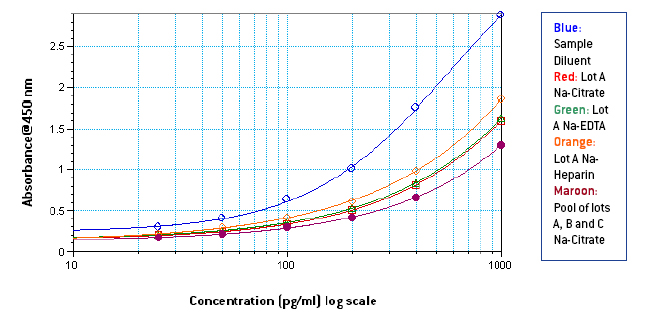
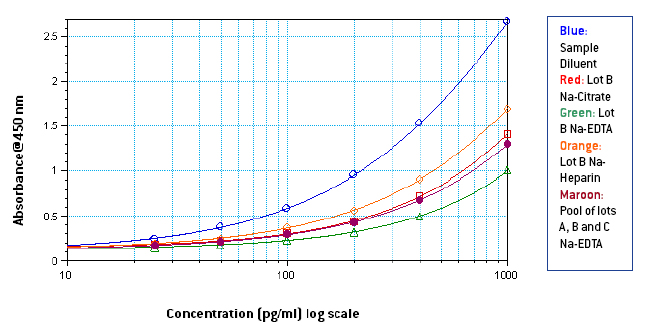
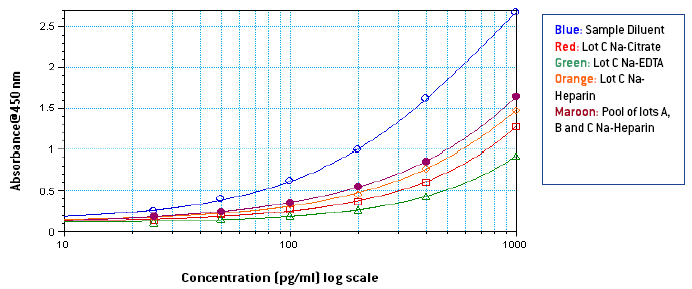
Figures 1-3: Standard curves from 1000-25 pg/ml in Sample Diluent, 3 different lots of neat plasma and neat pooled plasma using 3 different lots with different anti-coagulants
Figures 4-5: Standard curves from 500-12.5 pg/ml prepared in Sample Diluent, and 50% pooled plasma compared with standard curves from 1000-25 pg/ml in neat pooled plasma diluted to 500-12.5 pg/ml in Sample Diluent
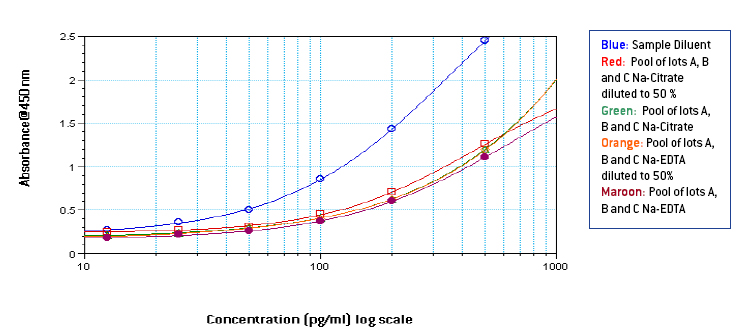
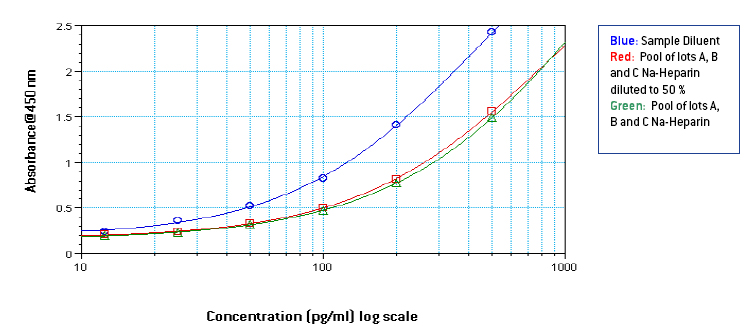
Table 1: % Spike Recovery of Human IFN alpha A2a from human plasma in different anti-coagulants
% Spike Recoveries
> Matrix
30 pg/ml
300 pg/ml
800 pg/ml
Lot D with Na-Citrate
61.2%
102.2%
91.5%
Lot E with Na-Citrate
79.1%
122.5%
127.5%
Lot D with Na-EDTA
60.6%
84.7%
76.81%
Lot E with Na-EDTA
58.6%
86.96%
91.23%
Lot D with Na-Heparin
91.88%
107.68%
94.88%
Lot E with Na-Heparin
98.76%
105.32%
106.53%
Average
75%
101.56%
98.1%
From figures 1-3, it is seen that signal in human plasma in Na-EDTA is lower than signal in human plasma in Na-Citrate and Na-Heparin. This effect is evident in pooled plasma as well. Signal in Na-Heparin plasma is the strongest amongst the three anti-coagulants. Also evident is the suppression of signal in human plasma, due to components in plasma, as compared to the signal in Sample Diluent. From figures 4-5, it is observed, on basis of the ODs for corresponding final concentrations of IFN Alpha on the plate, that a standard curve from 1000-25 pg/ml prepared in undiluted pooled plasma with 50 μl of the curve added to 50 μl of Sample Diluent on the plate is similar to a standard curve from 500-12.5 pg/ml prepared in 50 % pooled plasma regardless of the anti-coagulant used. However, due to the varying amounts and differences in components in plasma from different donors, the extent of similarity between the two curves can vary from lot to lot of plasma. From table 1, it is observed that the spike recovery for low concentration spikes of IFN Alpha A 2a (30 pg/ml) is lowest in case of plasma with Na-EDTA and highest in plasma with Na-Heparin. Overall, the average spike recoveries are within acceptable industry standards.
Conclusions
For accurate determination of concentration of Human IFN Alpha from plasma, the unknown plasma sample must be diluted 1:2 in the Sample Diluent. All pre-dilutions prior to the 1:2 dilution should be made in normal human plasma with the same anti-coagulant. The unknown concentration of the sample must be extrapolated from a standard curve (1000-25 pg/ml) prepared in normal human plasma having undetectable amounts of endogenous IFN alpha or a pool of endogenous IFN Alpha free plasma lots and 50 μl of the curve must be added to 50 μl of Sample Diluent on the plate. Spike recoveries from human plasma using product 41110 does vary from lot to lot of plasma. For most accurate results, the spike recovery should be extrapolated from a standard curve prepared in pooled plasma with the same anti-coagulant. The performance of product 41110 is best in plasma samples with Na-Heparin as the anti-coagulant and worst in plasma with Na-EDTA as the anti-coagulant.
Introduction
ELISA assay is based on the binding of a target molecule (analyte/antigen) to antibodies which specifically recognize the target. The presence of an antigen-antibody complex is detected using a secondary enzyme-conjugated antibody. Detection is obtained by addition of a substrate which yields a quantifiable signal. Standard curves are prepared by performing a dilution series of a known concentration of the analyte using different sample diluents. The non-linear 4-parameter fits of the curves are then used to calculate the concentration of an unknown sample in the similar diluent. The analyte to be measured can be present in different diluents such as tissue culture media with serum, neat serum, neat plasma, and salt buffers. In cases wherein the analyte to be measured is in serum or plasma, interference in the assay may arise due to presence of serum proteins, heterophilic antibodies and/or clotting factors. This may lead to detection of false positives, false negatives, or high backgrounds. In this study, we show that by using PBL’s VeriKine Human Alpha Multi-Subtype Serum ELISA kit 41110, on an average greater than 70% of actual concentration of low concentrations of Human Interferon (IFN) Alpha, can be detected in human plasma. We also show that false positives and false negatives at low concentrations of IFN are not seen, and high signals for blanks are absent. Additionally, we demonstrate that standard curves (500-12.5 pg/ml) prepared in pooled plasma pre-diluted to 50% in sample diluent or 2 X standard curves (1000-25 pg/ml) in neat pooled plasma diluted post preparation in sample diluent to 500-12.5 pg/ml are not significantly different.
Methods and Analysis
Standard curves were prepared from 1000 pg/ml-25 pg/ml in Sample Diluent, 3 lots of normal human plasma in different anti-coagulants (Na-Citrate, Na-EDTA and Na-Heparin) and in pools of the three lots. Additionally, low (30 pg/ml), medium (300 pg/ml) and high (800 pg/ml) spikes were prepared in two different lots of normal human plasma. These two lots were not from the lots used in the pool. Following this, 50 μl of the standard was added to 50 μl of Sample Diluent on the plate provided in product 41110-1 Human Interferon Alpha Serum Sample Multi-Subtype ELISA Kit. The remaining steps of the ELISA were performed as per the kit protocol. In a separate assay, standard curves from 1000-25 pg/ml in pooled human plasma and standard curves from 500-12.5 pg/ml in 50% pooled human plasma in diluted in Sample Diluent were compared. In this assay, 50 μl of the standards in pooled human plasma (1000-25 pg/ml) were added to 50 μl of Sample Diluent on the plate and in case of standards in 50 % pooled plasma (500-12.5 pg/ml) 100 μl was directly loaded on the plate. After completion of each assay, the plate(s) were read at 450 nm on a Vmax plate reader (Molecular Devices Corporation, CA). The Mean OD @ 450nm on Y-axis was plotted against the actual concentration in pg/ml on X-axis for each curve. The curves were generated using non-linear 4-parameter fit, (Figures 1-5).
Based on the curve fit equation and the Mean OD value for the data point, the extrapolated concentrations (backfit concentrations) were determined for each data point. All data was analyzed using SoftMax Pro version 5 (Molecular Devices Corporation, CA).
Figures 1-3: Standard curves from 1000-25 pg/ml in Sample Diluent, 3 different lots of neat plasma and neat pooled plasma using 3 different lots with different anti-coagulants
Figures 4-5: Standard curves from 500-12.5 pg/ml prepared in Sample Diluent, and 50% pooled plasma compared with standard curves from 1000-25 pg/ml in neat pooled plasma diluted to 500-12.5 pg/ml in Sample Diluent
Table 1: % Spike Recovery of Human IFN alpha A2a from human plasma in different anti-coagulants
| % Spike Recoveries | |||
| > Matrix | 30 pg/ml | 300 pg/ml | 800 pg/ml |
| Lot D with Na-Citrate | 61.2% | 102.2% | 91.5% |
| Lot E with Na-Citrate | 79.1% | 122.5% | 127.5% |
| Lot D with Na-EDTA | 60.6% | 84.7% | 76.81% |
| Lot E with Na-EDTA | 58.6% | 86.96% | 91.23% |
| Lot D with Na-Heparin | 91.88% | 107.68% | 94.88% |
| Lot E with Na-Heparin | 98.76% | 105.32% | 106.53% |
| Average | 75% | 101.56% | 98.1% |
From figures 1-3, it is seen that signal in human plasma in Na-EDTA is lower than signal in human plasma in Na-Citrate and Na-Heparin. This effect is evident in pooled plasma as well. Signal in Na-Heparin plasma is the strongest amongst the three anti-coagulants. Also evident is the suppression of signal in human plasma, due to components in plasma, as compared to the signal in Sample Diluent. From figures 4-5, it is observed, on basis of the ODs for corresponding final concentrations of IFN Alpha on the plate, that a standard curve from 1000-25 pg/ml prepared in undiluted pooled plasma with 50 μl of the curve added to 50 μl of Sample Diluent on the plate is similar to a standard curve from 500-12.5 pg/ml prepared in 50 % pooled plasma regardless of the anti-coagulant used. However, due to the varying amounts and differences in components in plasma from different donors, the extent of similarity between the two curves can vary from lot to lot of plasma. From table 1, it is observed that the spike recovery for low concentration spikes of IFN Alpha A 2a (30 pg/ml) is lowest in case of plasma with Na-EDTA and highest in plasma with Na-Heparin. Overall, the average spike recoveries are within acceptable industry standards.
Conclusions
For accurate determination of concentration of Human IFN Alpha from plasma, the unknown plasma sample must be diluted 1:2 in the Sample Diluent. All pre-dilutions prior to the 1:2 dilution should be made in normal human plasma with the same anti-coagulant. The unknown concentration of the sample must be extrapolated from a standard curve (1000-25 pg/ml) prepared in normal human plasma having undetectable amounts of endogenous IFN alpha or a pool of endogenous IFN Alpha free plasma lots and 50 μl of the curve must be added to 50 μl of Sample Diluent on the plate. Spike recoveries from human plasma using product 41110 does vary from lot to lot of plasma. For most accurate results, the spike recovery should be extrapolated from a standard curve prepared in pooled plasma with the same anti-coagulant. The performance of product 41110 is best in plasma samples with Na-Heparin as the anti-coagulant and worst in plasma with Na-EDTA as the anti-coagulant.