
For most analyses, a plot of response versus concentration will create a linear relationship, at least within a certain range of concentrations, and can be analyzed with linear regression. However, for those calibration plots which are sigmoid (a curve having an “S” shape), performing a linear fit can lead to errors in estimating sample concentration These inaccuracies are most significant at the extremes of the standard curve, most often in the low end but sometimes in the high end as well. In this study we compare the results of using linear fit and 4-parameter analysis on ELISA data and report our findings.
Methods
Standard curves were prepared using kits from two different ELISA products, VeriKine Mouse Interferon-Beta (Cat. No. 42400) and VeriKine Human Interferon-Alpha (Cat. No. 41100). The assays were performed following protocols for each product. After completion of each assay, plates were read at OD 450nm using Vmax Kinetic Plate Reader (Molecular Devices Corp., CA, USA). Triplicate measurements were performed for each data set. Data was analyzed using SoftMax Pro software (Molecular Devices Corp., CA, USA).
Analysis
The Mean of the ODs @ 450 nm, %CV of the ODs @ 450 nm, and the Standard Deviation between the ODs @ 450 nm for each data point of the standard curve was calculated. the concentration was plotted on the X-axis. the Mean OD@ 450 nm was plotted on the Y-axis
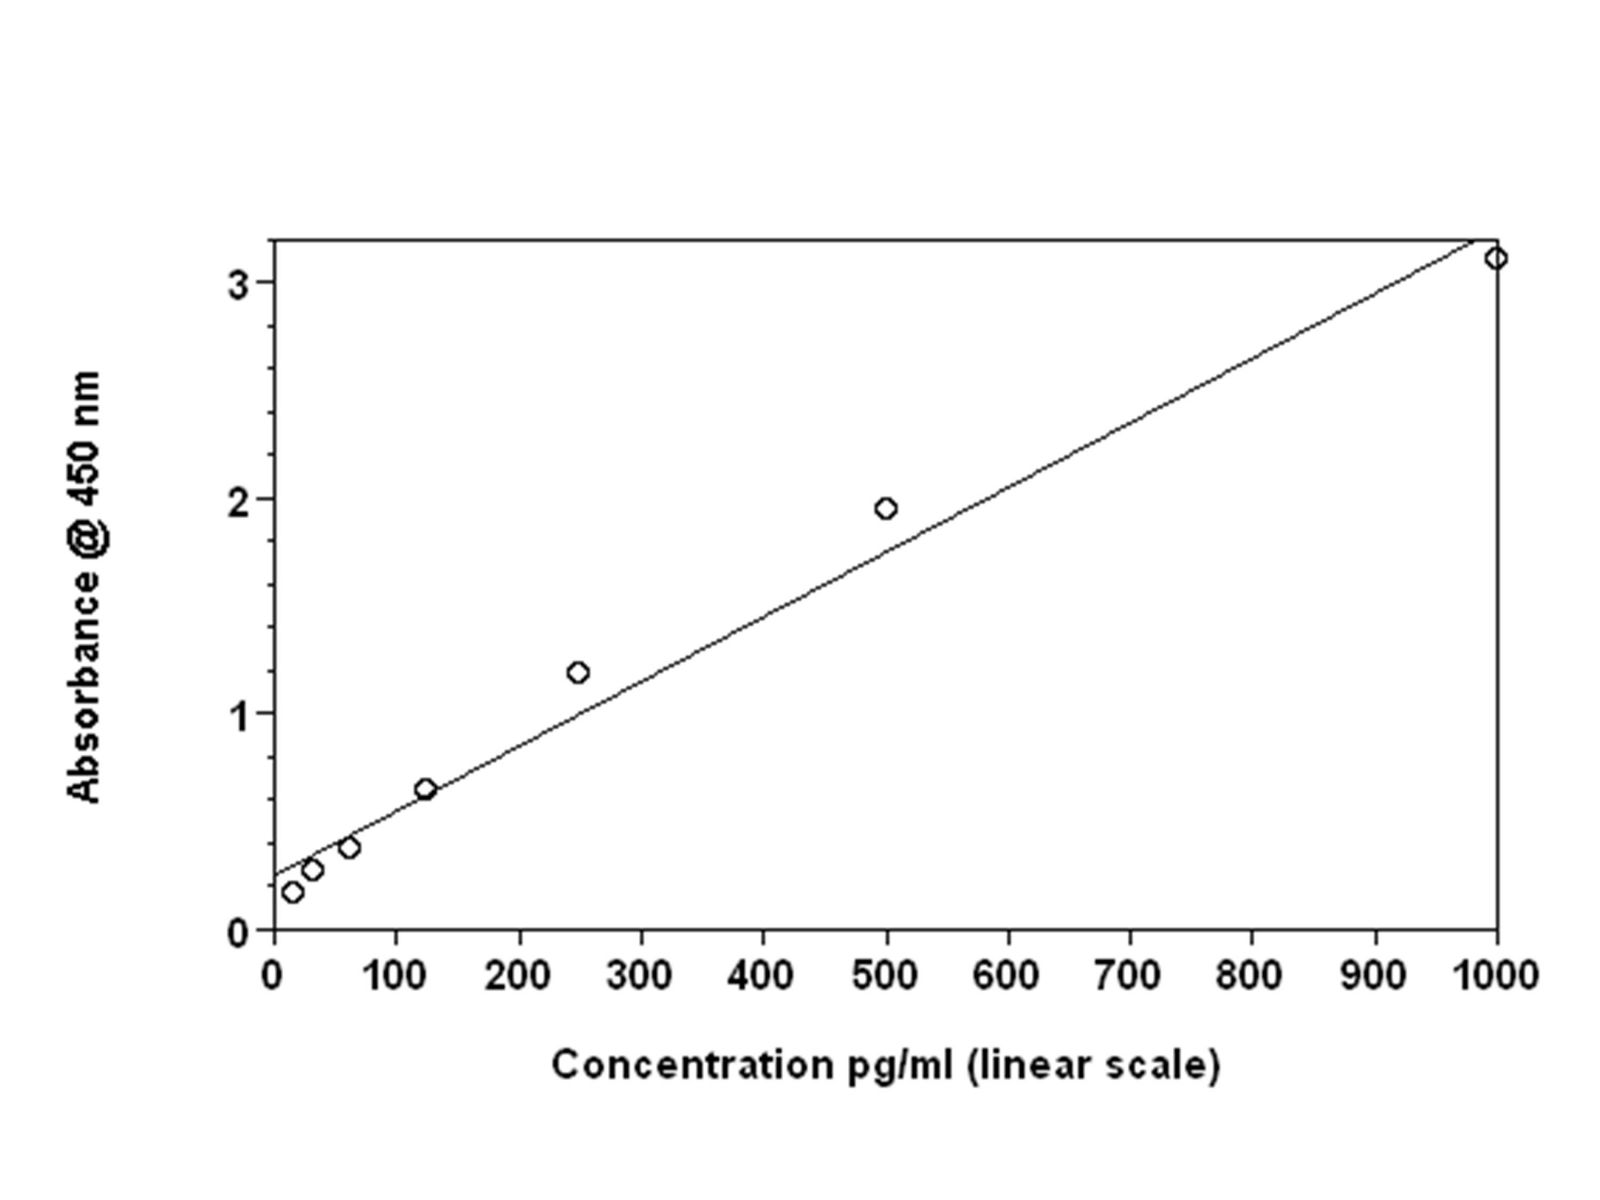
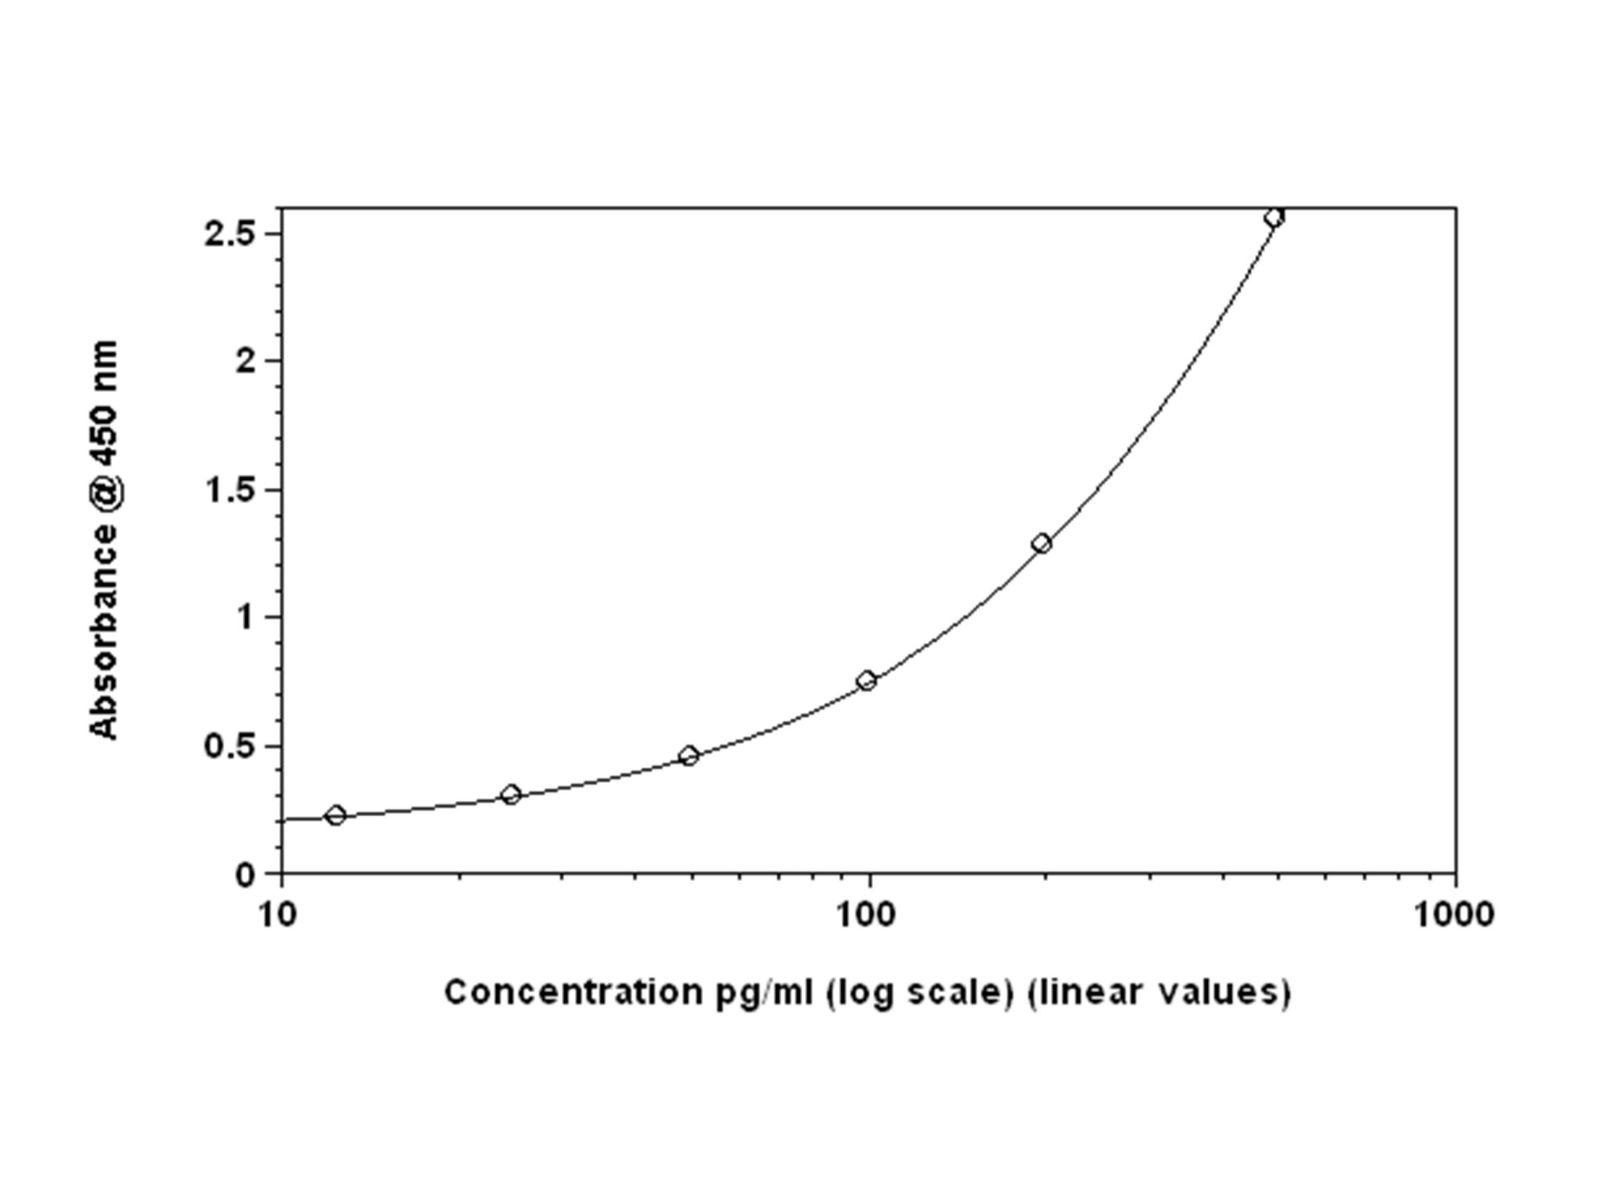
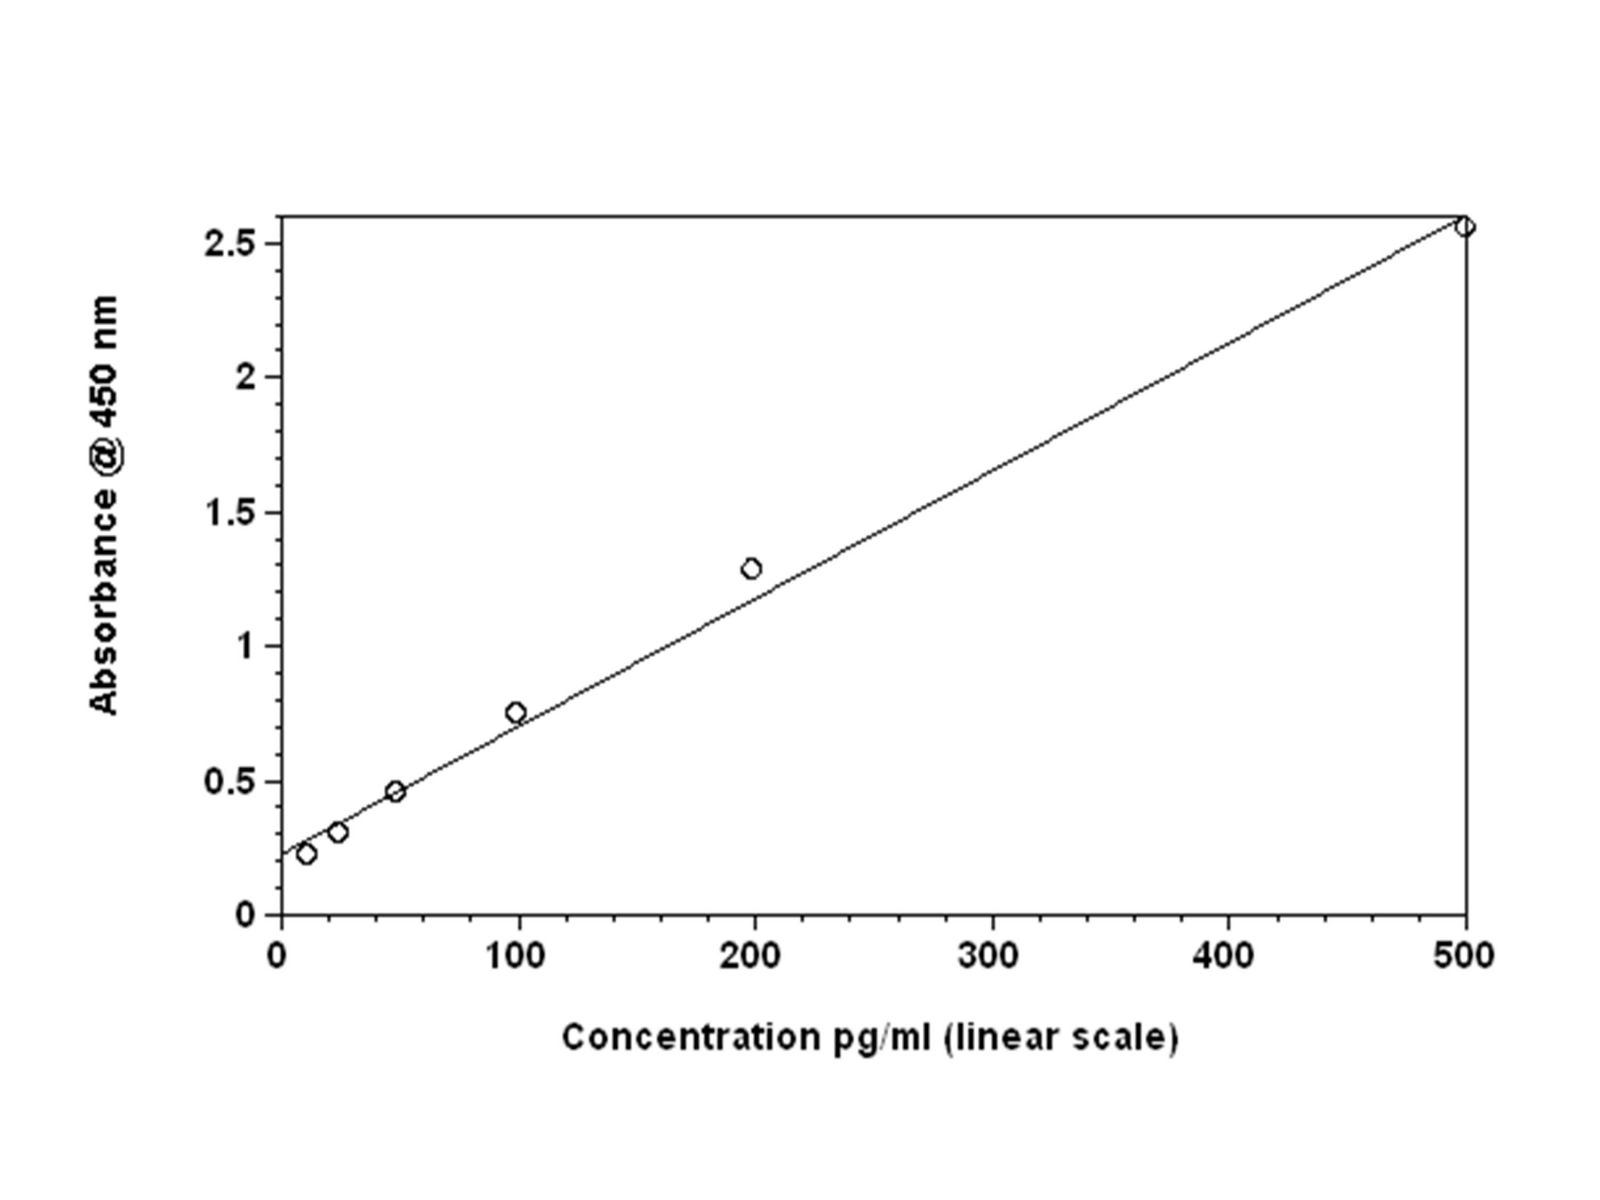
Standard curves were prepared using Mouse IFN-β ELISA kit and Human IFN-α ELISA kit. For each data set, two standard curves were created. One standard curve was plotted using a 4-parameter fit algorithm and the second one generated using linear fit analysis. Mean OD@450 nm for all data points vs. the actual concentration in pg/ml corresponding to that data point were plotted.
Figures 1: Standard curves for mouse IFN-β ELISA with linear fit
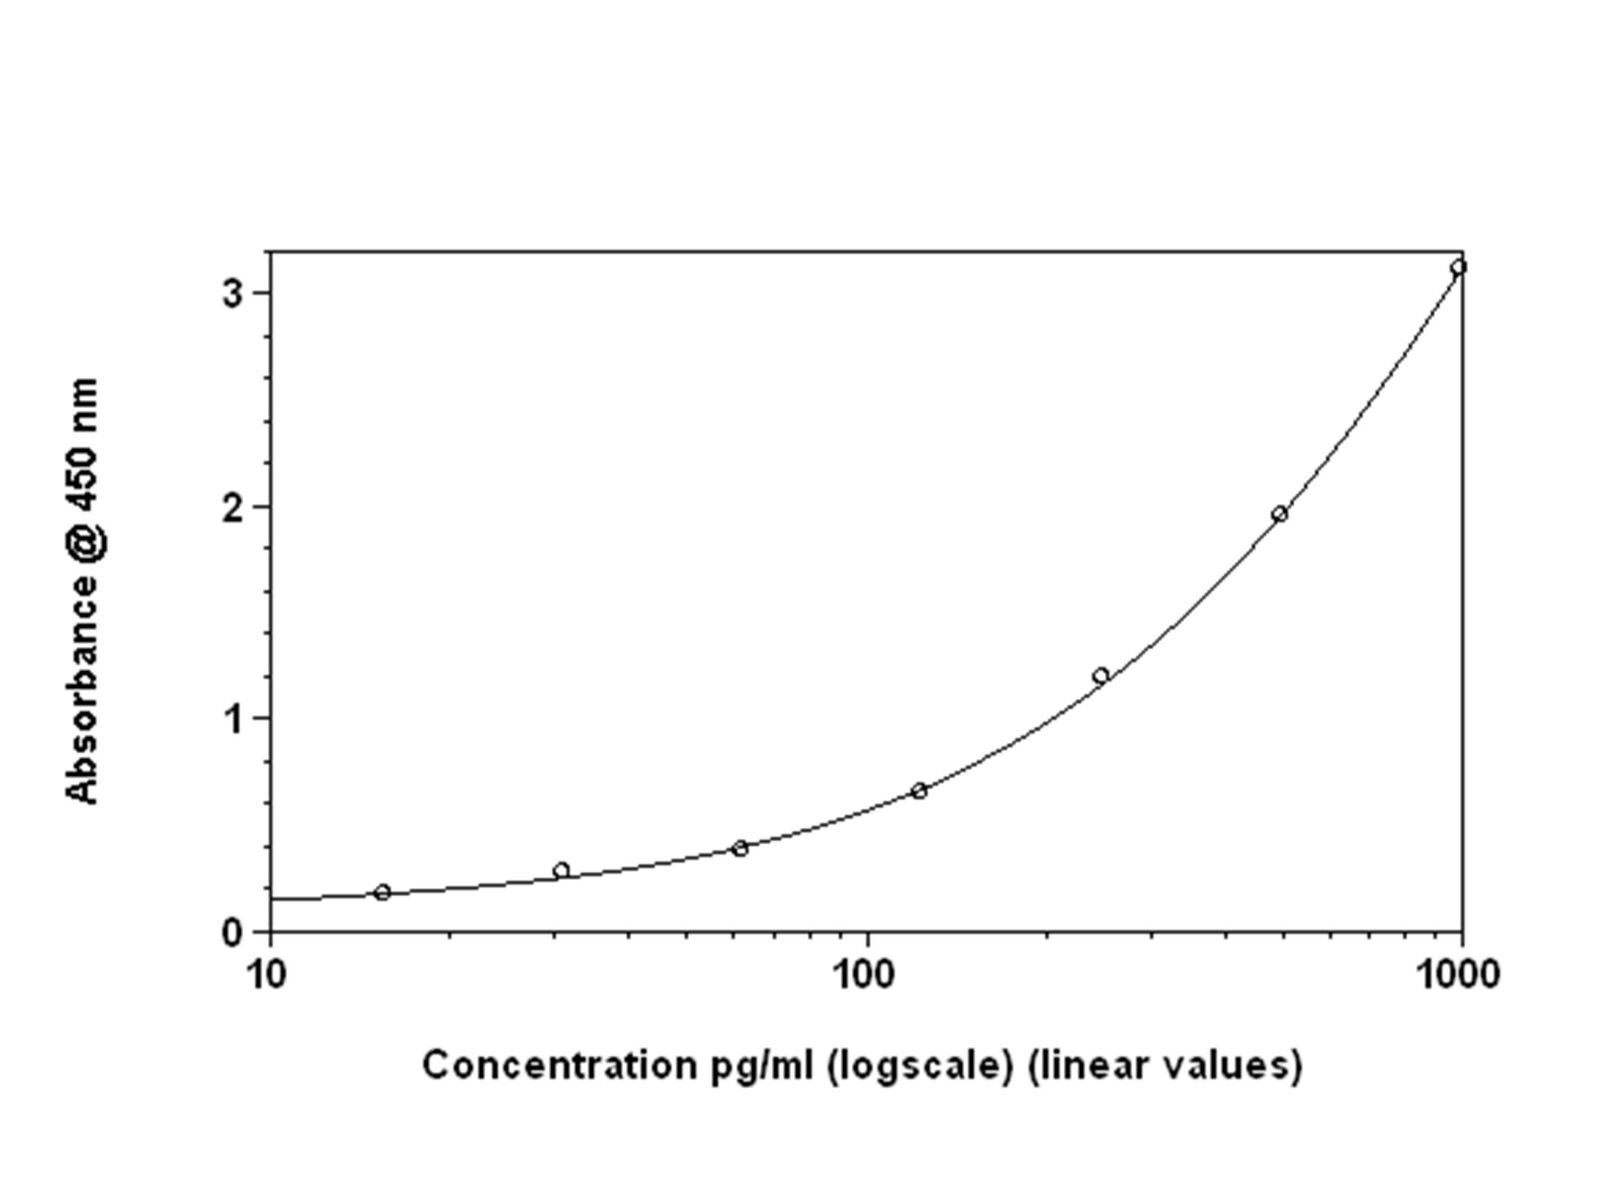
Figures 2A: Shows the same data set plotted with four-parameter curve fit
Comparing the backfitted interferon concentration values, four -parameter fit versus linear analysis, reveals disparities between the two methods. The largest discrepancies are noted at the lower concentrations. This trend is observed for both the Mouse IFN Beta and Human Alpha products (data not shown). Overall, the estimated interferon concentration values more closely match the actual concentration when applying a four-parameter fit (Table 1). Significant differences are seen for Mouse IFN beta at 15.625 pg/ml (~278%).
Table 1: The backfitted concentrations calculated with 4-parameter fit and linear fit for points on the standard curve for mouse IFN-β ELISA
4-Parameter fit
Linear fit
Actual Concentration (pg/ml)
Mean OD @ 450 nm
Backfit Concentration (pg/ml)
% Difference: Backfit and Actual Concentration
Backfit Concentration (pg/ml)
% Difference: Backfit and Actual Concentration
15.625
0.167
14.75
2.48
-27.05
278.84
31.25
0.268
35.86
14.75
6.59
78.91
62.5
0.374
58.72
6.05
41.90
32.96
125
0.645
120.42
3.66
132.16
5.73
250
1.186
258.74
3.50
312.26
24.90
500
1.943
494.51
1.10
564.52
12.90
1000
3.112
1001.53
0.15
954.01
4.60
Different methodologies are applied to mathematically fit data generated from ELISA experiments. To force an assay to fit the best straight line when the response is nonlinear will certainly introduce inaccuracy into your results. Thus, we recommend using four-parameter fit algorithm for plotting standard curves prepared using ELISA kits manufactured by PBL Assay Science.
For most analyses, a plot of response versus concentration will create a linear relationship, at least within a certain range of concentrations, and can be analyzed with linear regression. However, for those calibration plots which are sigmoid (a curve having an “S” shape), performing a linear fit can lead to errors in estimating sample concentration These inaccuracies are most significant at the extremes of the standard curve, most often in the low end but sometimes in the high end as well. In this study we compare the results of using linear fit and 4-parameter analysis on ELISA data and report our findings.
Methods
Standard curves were prepared using kits from two different ELISA products, VeriKine Mouse Interferon-Beta (Cat. No. 42400) and VeriKine Human Interferon-Alpha (Cat. No. 41100). The assays were performed following protocols for each product. After completion of each assay, plates were read at OD 450nm using Vmax Kinetic Plate Reader (Molecular Devices Corp., CA, USA). Triplicate measurements were performed for each data set. Data was analyzed using SoftMax Pro software (Molecular Devices Corp., CA, USA).
Analysis
The Mean of the ODs @ 450 nm, %CV of the ODs @ 450 nm, and the Standard Deviation between the ODs @ 450 nm for each data point of the standard curve was calculated. the concentration was plotted on the X-axis. the Mean OD@ 450 nm was plotted on the Y-axis
Standard curves were prepared using Mouse IFN-β ELISA kit and Human IFN-α ELISA kit. For each data set, two standard curves were created. One standard curve was plotted using a 4-parameter fit algorithm and the second one generated using linear fit analysis. Mean OD@450 nm for all data points vs. the actual concentration in pg/ml corresponding to that data point were plotted.
Comparing the backfitted interferon concentration values, four -parameter fit versus linear analysis, reveals disparities between the two methods. The largest discrepancies are noted at the lower concentrations. This trend is observed for both the Mouse IFN Beta and Human Alpha products (data not shown). Overall, the estimated interferon concentration values more closely match the actual concentration when applying a four-parameter fit (Table 1). Significant differences are seen for Mouse IFN beta at 15.625 pg/ml (~278%).
Table 1: The backfitted concentrations calculated with 4-parameter fit and linear fit for points on the standard curve for mouse IFN-β ELISA
|
4-Parameter fit |
Linear fit |
||||
|
Actual Concentration (pg/ml) |
Mean OD @ 450 nm |
Backfit Concentration (pg/ml) |
% Difference: Backfit and Actual Concentration |
Backfit Concentration (pg/ml) |
% Difference: Backfit and Actual Concentration |
|
15.625 |
0.167 |
14.75 |
2.48 |
-27.05 |
278.84 |
|
31.25 |
0.268 |
35.86 |
14.75 |
6.59 |
78.91 |
|
62.5 |
0.374 |
58.72 |
6.05 |
41.90 |
32.96 |
|
125 |
0.645 |
120.42 |
3.66 |
132.16 |
5.73 |
|
250 |
1.186 |
258.74 |
3.50 |
312.26 |
24.90 |
|
500 |
1.943 |
494.51 |
1.10 |
564.52 |
12.90 |
|
1000 |
3.112 |
1001.53 |
0.15 |
954.01 |
4.60 |
Different methodologies are applied to mathematically fit data generated from ELISA experiments. To force an assay to fit the best straight line when the response is nonlinear will certainly introduce inaccuracy into your results. Thus, we recommend using four-parameter fit algorithm for plotting standard curves prepared using ELISA kits manufactured by PBL Assay Science.
Related Article
Performance Characterization of a High Sensitivity Interferon Beta ELISA Kit in Healthy Serum, Patient Serum, and Plasma Samples
Read Article