
CPE Cell and Virus Combinations
Many combinations of cells and viruses can be used, but certain pairs tend to be used most frequently. To measure mouse interferons, researchers usually use L929 cells with either vesicular stomatitis virus (VSV), often the New Jersey strain, or encephalomyocarditis virus (EMCV). This cell line is sensitive to alpha, beta and gamma interferon. For the measurement of human interferon a wider variety of systems are used. Many researchers will use the human lung carcinoma cell line A549 due to their ease of growth and relatively high sensitivity to all forms of human interferons. These cells are usually challenged with EMCV. Human alpha interferon can be assayed using the bovine kidney line MDBK challenged with VSV. One advantage of this system is the relative insensitivity of the bovine cells to human IFN-beta and gamma giving some selectivity in uncharacterized samples. Human IFN-beta can also be measured on the green monkey kidney cell line Vero challenged with VSV. The advantage of this assay is that human IFN-alpha is much less active on these cells than IFN-beta.
CPE Application
Treatment of cells with IFN leads to the production of a whole host of proteins, many of which interfere with viral replication. As noted above, very little receptor occupancy is required to lead to effective protection, but some time is required for the synthesis of the new proteins. Generally, IFN is pre-incubated with the cells for 4 (rapid assay) to 24 hours (sensitive assay) prior to viral challenge. Depending upon the cell and virus combination, the cells are then incubated for a further 24-48 hours to effect nearly complete killing of the unprotected cells.
CPE assays are generally developed as follows. Cells are plated in 96 well tissue culture plates at defined density. This density is chosen to ensure that cells not challenged with virus are just confluent at the end of the assay. Interferon is titrated by two fold dilution across the plate (12 data points) in duplicate or triplicate. Often a pre-dilution is required. The goal is to dilute the sample sufficiently to have the interferon concentration range from protecting the cells to not protecting roughly near the center wells of the plate. In addition, a standard is included to allow determination of the activity in Units/ml. These standards are generally laboratory standards which have been calibrated by numerous repeated assays using one of the International standards. Also included is one row which receives no IFN. After incubation of the cells with IFN, virus is added to all the wells which received either IFN sample or standard. Virus is also added to 6 wells in the row without IFN, while the other 6 wells receive media with no virus. The 6 wells receiving virus but no IFN serve as the “virus control” and provide the control for 0% protection. The 6 wells receiving no IFN and no virus serve as the “cell control” and provide the control for 100% protection. The amount of virus to be added is determined empirically. Usually, the virus will be added between 0.1 and 1 MOI and approximates the amount of virus that kills very close to 100% of the untreated cells in the desired incubation time.
The plates are monitored microscopically occasionally during the incubation time. Once viral killing is complete, the assay is developed. The classic, and still most common, method involves fixing and staining the plates with an acid/methanol solution containing Crystal Violet dye. This dye will stain any remaining cells attached to the plate. Alternatively vital stains such as neutral red can be used. Assays can also be developed using dyes such as XTT, MTT or MTS which measure mitochondrial activity or surviving cells. In the crystal violet assay, the excess stain is washed off the cells with water or PBS, and the plate is then dried.
Figure 1: A549/EMCV CPE Assay for Alpha IFN
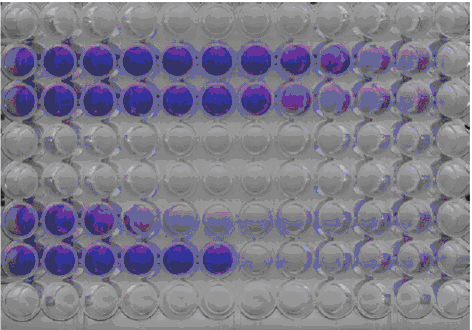
Rows B and C contain an unknown sample. Row F contains the IFN lab standard.
Row G, well 1-6 are the cell control and wells 7-12 are the virus control.
Once dry, the plate is examined microscopically. Wells are examined and the well in which 50% of the cells are alive, the endpoint, is noted. This is also noted for the standard. Since the Unitage of the standard is known, it can be used to calculate the U/ml of the unknown sample. For example, a standard of 2500 U/ml reaches an endpoint at well 4 on the plate. If the unknown sample has not been pre-diluted and reaches and endpoint at well 9, it contains 32 times the protective activity based on fold dilution/well raised to the number of wells different (25 = 32). 2500 U/ml standard endpoint times 32 yields 80,000 U/ml for the concentration of the interferon in the unknown. Sometimes a sample will reach an endpoint between wells. Say there is 80% protection in well 9 and 20% protection in well 10, the endpoint is recorded as well 9.5. The Unitage would then be the geometric mean of the values obtained at wells 9 and 10. In the above example, well 8 would be 80,000 U/ml, well 9 would be 160,000 U/ml and well 9.5 would be 113,137 U/ml. Generally, within a single assay the endpoint will be within 1 well for replicates. The calculated values for each replicate are then arithmetically averaged to obtain the U/ml for the sample. Thus a sample that gave endpoints of 8 and 9 would have unitage of 120,000 (Average of 80,000 and 160,000).
If the concentration of the IFN in the samples is known, it is also then possible to calculate the specific activity. To do this, one divides the U/ml by the concentration in mg/ml, the results are then expressed as U/mg. In the above example, if the concentration of the sample is 0.0004 mg/ml the specific activity would be 3.0 x 10⁸ U/mg (calculated as 120,000 U/ml divided by 0.0004 mg/ml), a value which is typical for an IFN alpha or beta sample.
A further analysis can be done by solubilizing the dye in the cells using a solution such as 70% MeOH. This then allows determination of the absorbance in the wells using a plate reader. Again, using the cell control as 100% protection and the virus control as 0% protection a curve can be plotted and the EC50 determined either in U/ml or pg/ml.
Figure 2. Graphic Analysis of IFN CPE Assay
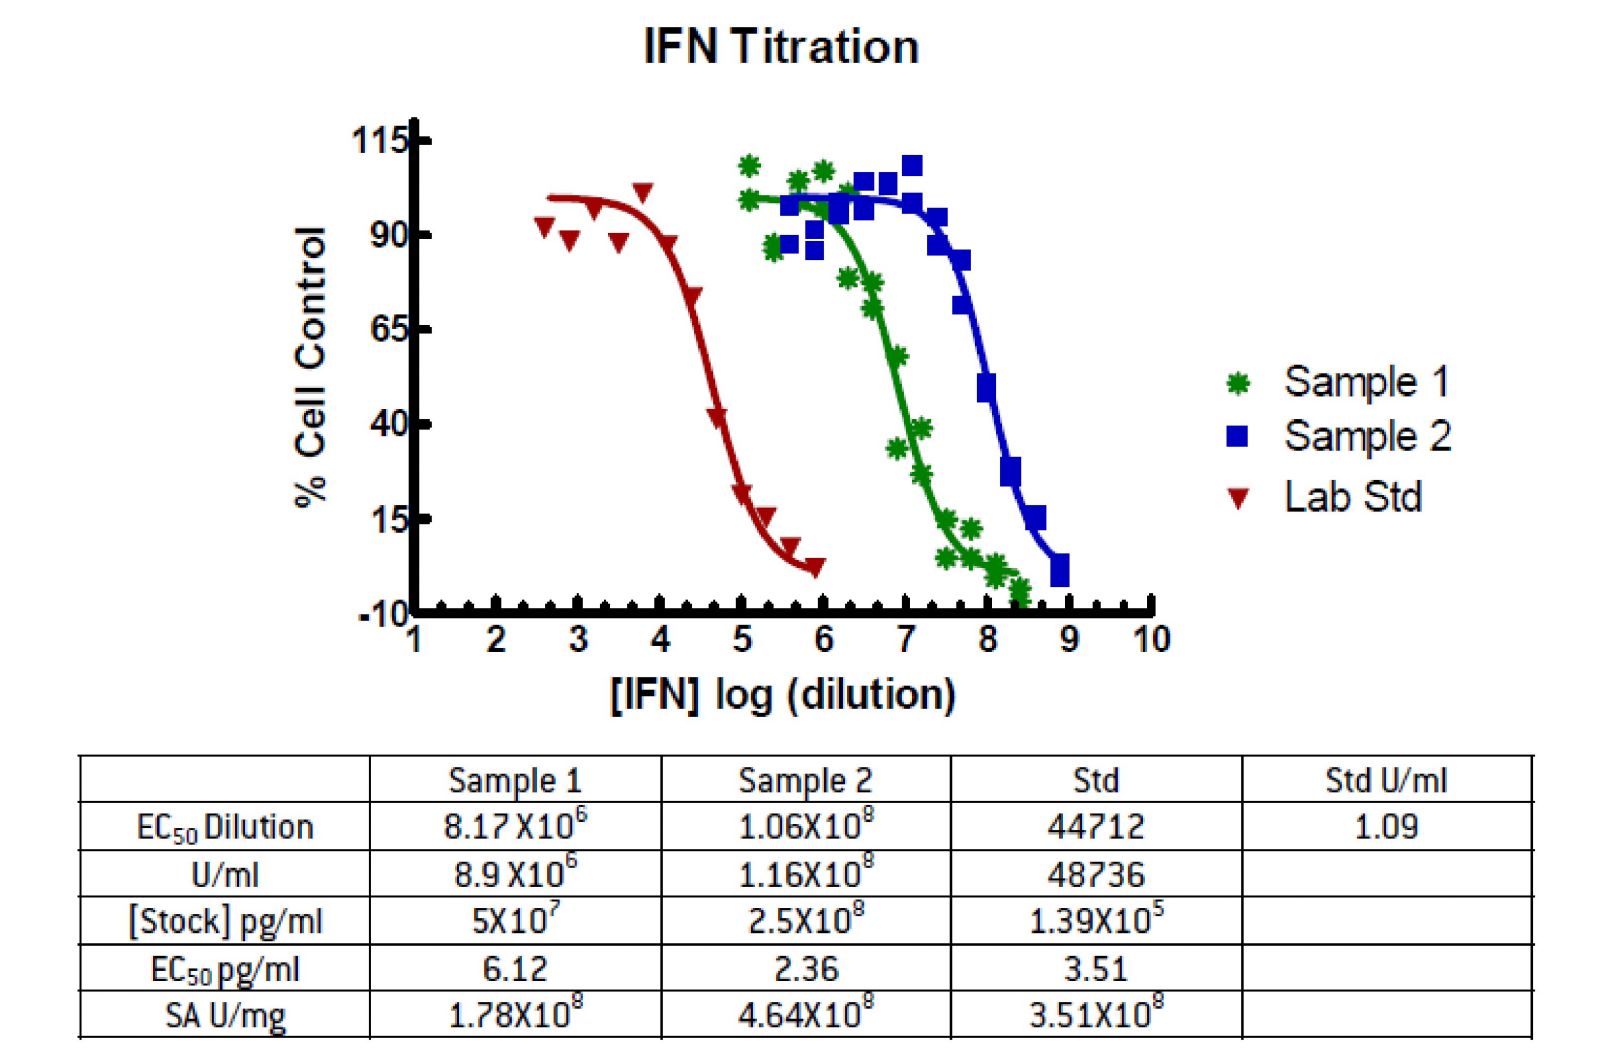
Data were fit to a sigmoidal dose response curve (variable slope) using the GraphPad Prism software package. The EC50 values were determined for each sample as the dilution from the stock required to give 50% protection. From the known unitage of the Lab Standard it is possible to determine the IFN concentration required to protect 50% of the cells. In this case 1.09 U/ml gives 50% protection. The U/ml is then the Std. U/ml EC50 times this dilution. Again, knowing the concentration of the sample it is possible to determine the pg/ml which gives 50% protection and the Specific Activity of the samples.
Since bioassays are inherently complex assays which vary due to the metabolic state of the cells, the ability of the IFN to protect the cells, and the virus replication, there will be greater variability in these assays than mass based assays such as ELISAs. For example, during the calibration of the international standard for beta interferon which was a multi-site, multi-assay study, the geometric CVs obtained were on the order of 60-80%. Generally in these assays, results from run to run and operator to operator can vary by about 1/2 log from the actual value. Thus, in order to obtain solid numbers, multiple runs are required. With experience and careful control, the CV value can be reduced (related service link here).
Below are the results from 3 different operators over a 4 week period for the Lab Standard in the A549/EMCV assay. The nominal titer (determined by 20 runs versus the international standard) is 4276 U/ml. In this study, the average potency is 3996 and the CV is 33%. The geometric mean is 3885 and the geometric CV is 13%.
Run 1
Run 2
Run 3
Run 4
Run 5
Run 6
Run 7
U/ml
2.80 x 10³
6.31 x 10³
4.53 x 10³
3.97 x 10³
3.31 x 10³
2.90 x 10³
4.14 x 10³
In summary, there are multiple methods available to measure the potency of a particular IFN preparation. The standard assay measures protection from viral challenge. However there can be significant variation in the results obtained in different assay systems with a particular interferon.
CPE Cell and Virus Combinations
Many combinations of cells and viruses can be used, but certain pairs tend to be used most frequently. To measure mouse interferons, researchers usually use L929 cells with either vesicular stomatitis virus (VSV), often the New Jersey strain, or encephalomyocarditis virus (EMCV). This cell line is sensitive to alpha, beta and gamma interferon. For the measurement of human interferon a wider variety of systems are used. Many researchers will use the human lung carcinoma cell line A549 due to their ease of growth and relatively high sensitivity to all forms of human interferons. These cells are usually challenged with EMCV. Human alpha interferon can be assayed using the bovine kidney line MDBK challenged with VSV. One advantage of this system is the relative insensitivity of the bovine cells to human IFN-beta and gamma giving some selectivity in uncharacterized samples. Human IFN-beta can also be measured on the green monkey kidney cell line Vero challenged with VSV. The advantage of this assay is that human IFN-alpha is much less active on these cells than IFN-beta.
CPE Application
Treatment of cells with IFN leads to the production of a whole host of proteins, many of which interfere with viral replication. As noted above, very little receptor occupancy is required to lead to effective protection, but some time is required for the synthesis of the new proteins. Generally, IFN is pre-incubated with the cells for 4 (rapid assay) to 24 hours (sensitive assay) prior to viral challenge. Depending upon the cell and virus combination, the cells are then incubated for a further 24-48 hours to effect nearly complete killing of the unprotected cells.
CPE assays are generally developed as follows. Cells are plated in 96 well tissue culture plates at defined density. This density is chosen to ensure that cells not challenged with virus are just confluent at the end of the assay. Interferon is titrated by two fold dilution across the plate (12 data points) in duplicate or triplicate. Often a pre-dilution is required. The goal is to dilute the sample sufficiently to have the interferon concentration range from protecting the cells to not protecting roughly near the center wells of the plate. In addition, a standard is included to allow determination of the activity in Units/ml. These standards are generally laboratory standards which have been calibrated by numerous repeated assays using one of the International standards. Also included is one row which receives no IFN. After incubation of the cells with IFN, virus is added to all the wells which received either IFN sample or standard. Virus is also added to 6 wells in the row without IFN, while the other 6 wells receive media with no virus. The 6 wells receiving virus but no IFN serve as the “virus control” and provide the control for 0% protection. The 6 wells receiving no IFN and no virus serve as the “cell control” and provide the control for 100% protection. The amount of virus to be added is determined empirically. Usually, the virus will be added between 0.1 and 1 MOI and approximates the amount of virus that kills very close to 100% of the untreated cells in the desired incubation time.
The plates are monitored microscopically occasionally during the incubation time. Once viral killing is complete, the assay is developed. The classic, and still most common, method involves fixing and staining the plates with an acid/methanol solution containing Crystal Violet dye. This dye will stain any remaining cells attached to the plate. Alternatively vital stains such as neutral red can be used. Assays can also be developed using dyes such as XTT, MTT or MTS which measure mitochondrial activity or surviving cells. In the crystal violet assay, the excess stain is washed off the cells with water or PBS, and the plate is then dried.
Rows B and C contain an unknown sample. Row F contains the IFN lab standard.
Row G, well 1-6 are the cell control and wells 7-12 are the virus control.
Once dry, the plate is examined microscopically. Wells are examined and the well in which 50% of the cells are alive, the endpoint, is noted. This is also noted for the standard. Since the Unitage of the standard is known, it can be used to calculate the U/ml of the unknown sample. For example, a standard of 2500 U/ml reaches an endpoint at well 4 on the plate. If the unknown sample has not been pre-diluted and reaches and endpoint at well 9, it contains 32 times the protective activity based on fold dilution/well raised to the number of wells different (25 = 32). 2500 U/ml standard endpoint times 32 yields 80,000 U/ml for the concentration of the interferon in the unknown. Sometimes a sample will reach an endpoint between wells. Say there is 80% protection in well 9 and 20% protection in well 10, the endpoint is recorded as well 9.5. The Unitage would then be the geometric mean of the values obtained at wells 9 and 10. In the above example, well 8 would be 80,000 U/ml, well 9 would be 160,000 U/ml and well 9.5 would be 113,137 U/ml. Generally, within a single assay the endpoint will be within 1 well for replicates. The calculated values for each replicate are then arithmetically averaged to obtain the U/ml for the sample. Thus a sample that gave endpoints of 8 and 9 would have unitage of 120,000 (Average of 80,000 and 160,000).
If the concentration of the IFN in the samples is known, it is also then possible to calculate the specific activity. To do this, one divides the U/ml by the concentration in mg/ml, the results are then expressed as U/mg. In the above example, if the concentration of the sample is 0.0004 mg/ml the specific activity would be 3.0 x 10⁸ U/mg (calculated as 120,000 U/ml divided by 0.0004 mg/ml), a value which is typical for an IFN alpha or beta sample.
A further analysis can be done by solubilizing the dye in the cells using a solution such as 70% MeOH. This then allows determination of the absorbance in the wells using a plate reader. Again, using the cell control as 100% protection and the virus control as 0% protection a curve can be plotted and the EC50 determined either in U/ml or pg/ml.
Figure 2. Graphic Analysis of IFN CPE Assay
Data were fit to a sigmoidal dose response curve (variable slope) using the GraphPad Prism software package. The EC50 values were determined for each sample as the dilution from the stock required to give 50% protection. From the known unitage of the Lab Standard it is possible to determine the IFN concentration required to protect 50% of the cells. In this case 1.09 U/ml gives 50% protection. The U/ml is then the Std. U/ml EC50 times this dilution. Again, knowing the concentration of the sample it is possible to determine the pg/ml which gives 50% protection and the Specific Activity of the samples.
Since bioassays are inherently complex assays which vary due to the metabolic state of the cells, the ability of the IFN to protect the cells, and the virus replication, there will be greater variability in these assays than mass based assays such as ELISAs. For example, during the calibration of the international standard for beta interferon which was a multi-site, multi-assay study, the geometric CVs obtained were on the order of 60-80%. Generally in these assays, results from run to run and operator to operator can vary by about 1/2 log from the actual value. Thus, in order to obtain solid numbers, multiple runs are required. With experience and careful control, the CV value can be reduced (related service link here).
Below are the results from 3 different operators over a 4 week period for the Lab Standard in the A549/EMCV assay. The nominal titer (determined by 20 runs versus the international standard) is 4276 U/ml. In this study, the average potency is 3996 and the CV is 33%. The geometric mean is 3885 and the geometric CV is 13%.
| Run 1 | Run 2 | Run 3 | Run 4 | Run 5 | Run 6 | Run 7 | |
|---|---|---|---|---|---|---|---|
| U/ml | 2.80 x 10³ | 6.31 x 10³ | 4.53 x 10³ | 3.97 x 10³ | 3.31 x 10³ | 2.90 x 10³ | 4.14 x 10³ |
In summary, there are multiple methods available to measure the potency of a particular IFN preparation. The standard assay measures protection from viral challenge. However there can be significant variation in the results obtained in different assay systems with a particular interferon.