
Materials and Methods
Influenza and Healthy Donor sera were obtained from BioIVT and BioChemed. Both sources have IRB approval for biomarker studies. Samples were aliquoted and frozen on arrival, and no more than 1 additional freeze thaw was performed before biomarker interrogation. IFN-α (PBL 41115), IFN-β (PBL 41415), IFN-γ (MSD K151QOD) Neopterin (IBL RE59321), and Beta 2-Microglobulin (R&D KGE019) were measured by singleplex ELISA. IFN-α, IFN-β, IFN-ω, IFN-γ, IFN-λ, IL-1α, IL-6, TNF-α, and CXCL-10 were measured by a plate based chemiluminescent multiplex assay (PBL 51500). IFN-γ, IL-1β, Il-2, IL-4, IL-6, IL-8, IL-10, IL-12p70, IL-13, CXCL-10, and TNF-α were analyzed through electrochemiluminescent multiplex assay (MSD K15049D and K15047D). All commercial assays were run by the manufacturers’ protocols. IFN-ω immunoassay was developed using 2 monoclonal antibodies from Thermo-Fisher on the Simoa© platform using the homebrew assay development kit (Quanterix). The sensitivity of the final assay was 0.06 pg/ml.
Statistical Analysis
Donor classes (Healthy and Influenza) were defined based on the clinical diagnosis of disease state. Samples displaying a concentration below the analytical sensitivity of a given assay were assigned a corrected value based on the manufacturer’s limit of detection claim. Biomarker populations were compared between stratified groups by Mann-Whitney U-Test. Correlations between different biomarker distributions for the Influenza cohort were compared under Spearman conditions and excluded samples which exhibited a double negative result on the respective assays. An alpha value of 0.05 was assigned during all statistical analysis to demarcate statistical significance.
Study Interpretations
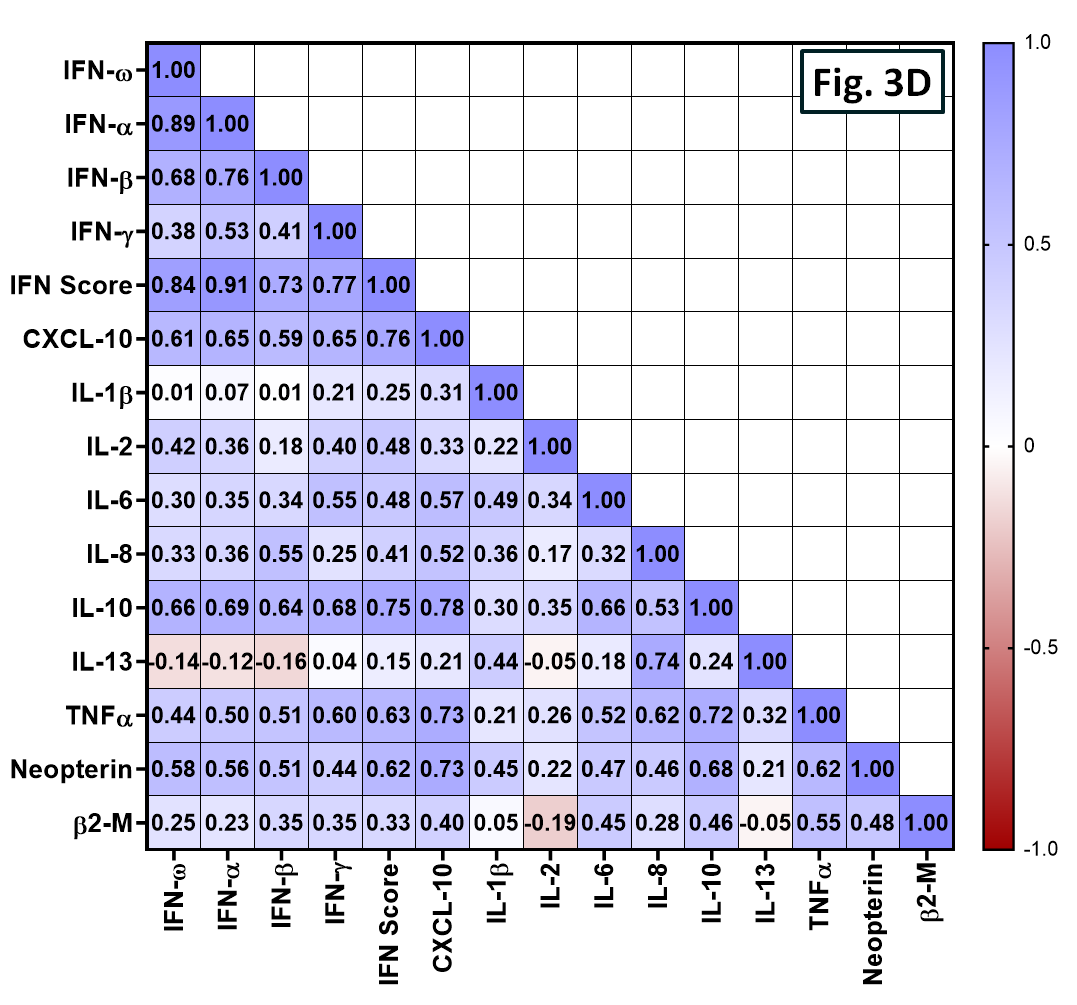
Upregulation between Type I and II Interferons (IFN-α, β, γ, and ω) are prevalent and well-correlated during the incidence of Influenza. CXCL-10, TNF-α, IL-10, and Neopterin levels trended positively against the combined Interferon Score. A larger Influenza cohort can provide greater interpretations towards clinical biomarker crosstalk and disease prominence.
Table 1. Demographics of Healthy and Influenza Cohorts.
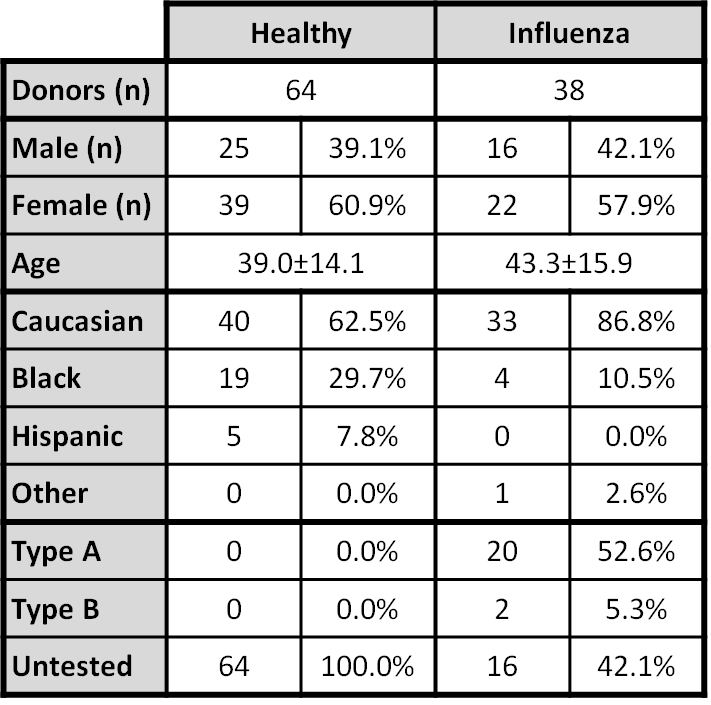
Table 2. Biomarker, Statistical, and Readability Metrics among Cohorts.
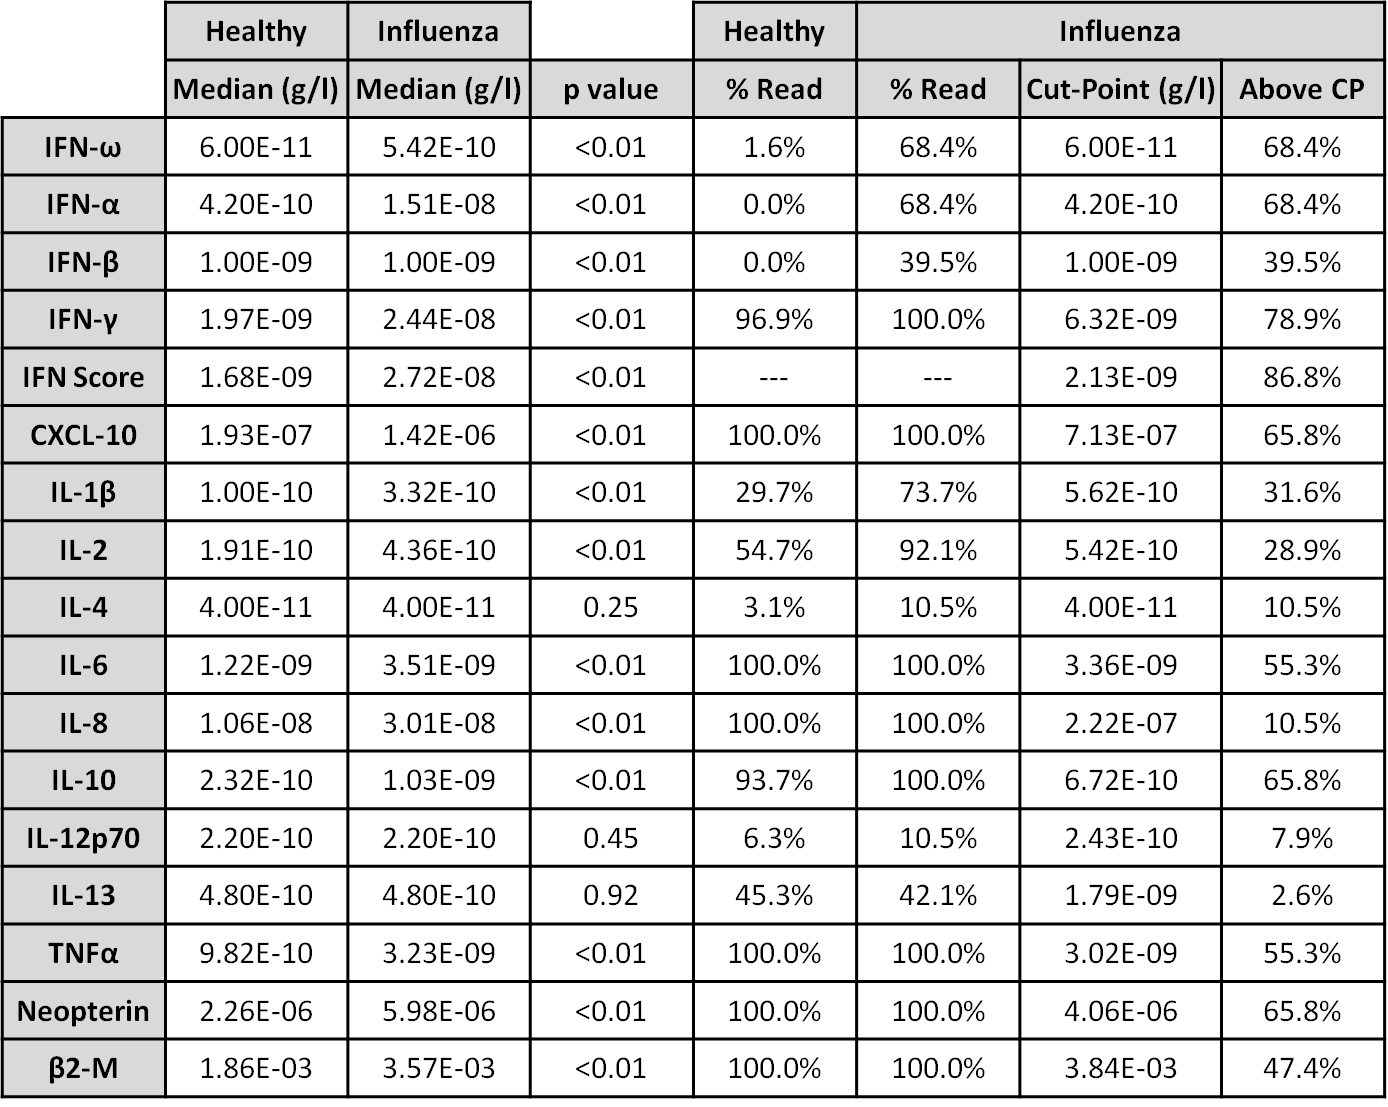
Figure 1. Scatter plots outlining the median and inter-quartile range of individual biomarker levels among healthy (gray, n=64) and influenza (red, n=38) cohorts.
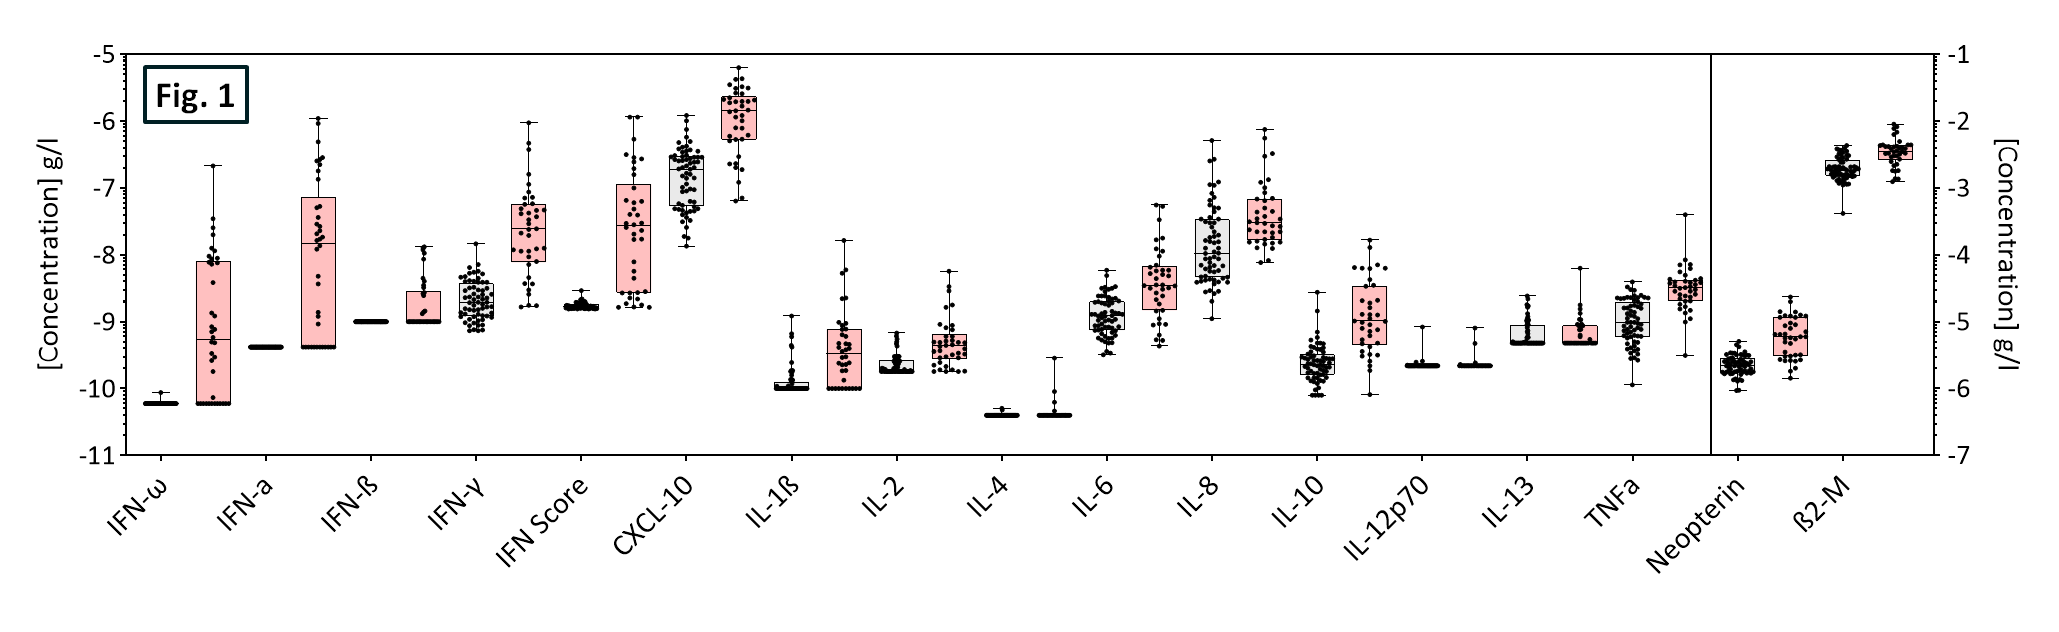
Figure 2. Heat map visualization of influenza (“flu”) patient biomarker stratification at levels above (blue) or below (red) the healthy population cut-point (95th percentile).
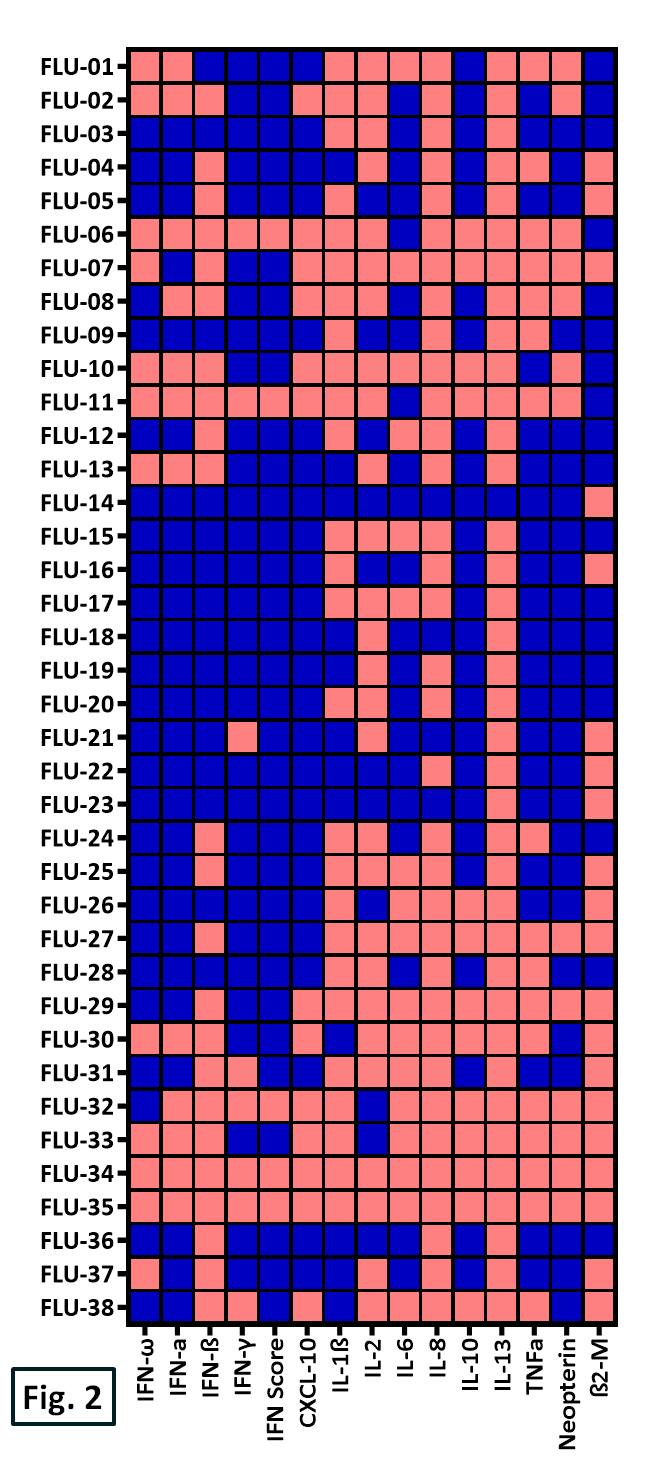
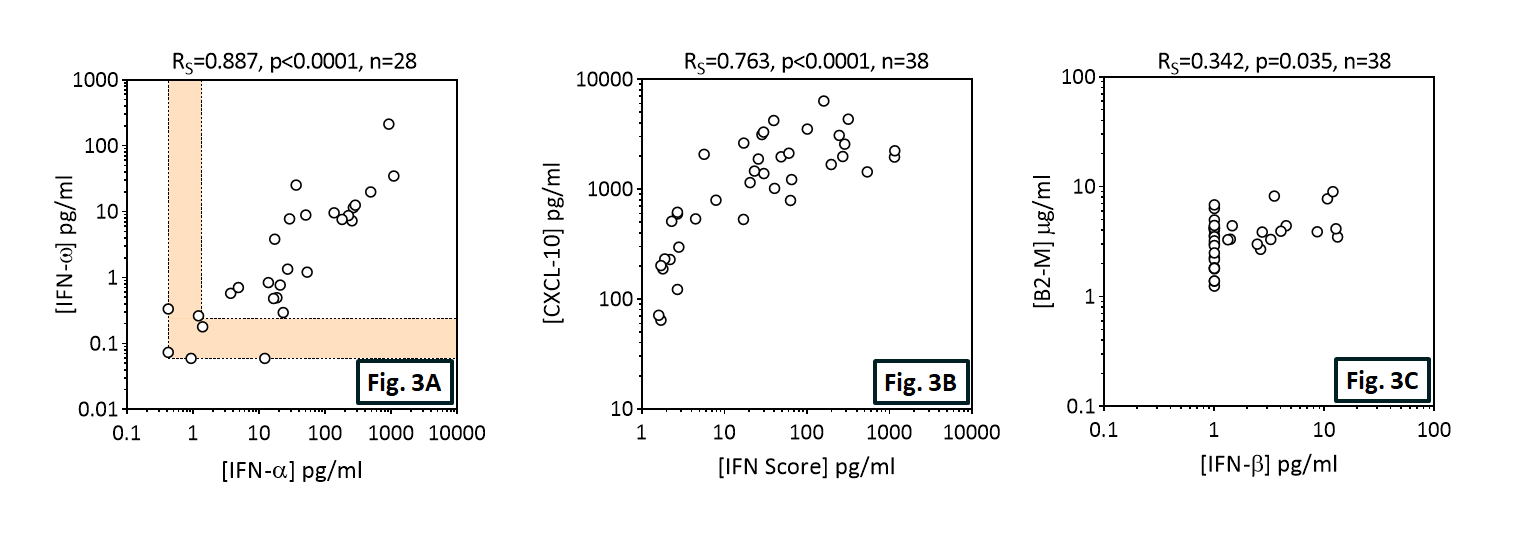
Figure 3. Spearman correlation metrics of the Influenza cohort. (A-C) Individual scatter plots and resolved p-values of correlation for selected biomarkers or IFN score. (D) Contemplation of Spearman R values between paired biomarkers. Samples displaying a double negative response were omitted during Spearman analysis.
Conclusions
- IFN-Alpha and IFN-Omega are highly correlated in Influenza patient sera.
- CXCL-10 correlates well with IFN-Score in Influenza.
- Little or no IFN-Alpha, IFN-Beta, or IFN-Omega is detected in healthy donors.
- Larger cohorts with more complete patient information should provide more robust results.
- Initial small studies with Hepatitis B and C donors show no Type I IFN.
- Acute vs. chronic viral infection?
References
1. Llibre et al. Front. Cell Infect. Microbiol. 2019 Aug 22; 9:296. Alpha and Beta in Flu.
2. Pizzini et al. Influenza Other Respir. Viruses. 2019 Sep 6. Neopterin in Flu.
3. Hoffmann et al. Sci. Rep. 2016 Dec 6; 6:38532. IP-10, IFN-γ in Flu and Pneumonia.
Materials and Methods
Influenza and Healthy Donor sera were obtained from BioIVT and BioChemed. Both sources have IRB approval for biomarker studies. Samples were aliquoted and frozen on arrival, and no more than 1 additional freeze thaw was performed before biomarker interrogation. IFN-α (PBL 41115), IFN-β (PBL 41415), IFN-γ (MSD K151QOD) Neopterin (IBL RE59321), and Beta 2-Microglobulin (R&D KGE019) were measured by singleplex ELISA. IFN-α, IFN-β, IFN-ω, IFN-γ, IFN-λ, IL-1α, IL-6, TNF-α, and CXCL-10 were measured by a plate based chemiluminescent multiplex assay (PBL 51500). IFN-γ, IL-1β, Il-2, IL-4, IL-6, IL-8, IL-10, IL-12p70, IL-13, CXCL-10, and TNF-α were analyzed through electrochemiluminescent multiplex assay (MSD K15049D and K15047D). All commercial assays were run by the manufacturers’ protocols. IFN-ω immunoassay was developed using 2 monoclonal antibodies from Thermo-Fisher on the Simoa© platform using the homebrew assay development kit (Quanterix). The sensitivity of the final assay was 0.06 pg/ml.
Statistical Analysis
Donor classes (Healthy and Influenza) were defined based on the clinical diagnosis of disease state. Samples displaying a concentration below the analytical sensitivity of a given assay were assigned a corrected value based on the manufacturer’s limit of detection claim. Biomarker populations were compared between stratified groups by Mann-Whitney U-Test. Correlations between different biomarker distributions for the Influenza cohort were compared under Spearman conditions and excluded samples which exhibited a double negative result on the respective assays. An alpha value of 0.05 was assigned during all statistical analysis to demarcate statistical significance.
Study Interpretations
Upregulation between Type I and II Interferons (IFN-α, β, γ, and ω) are prevalent and well-correlated during the incidence of Influenza. CXCL-10, TNF-α, IL-10, and Neopterin levels trended positively against the combined Interferon Score. A larger Influenza cohort can provide greater interpretations towards clinical biomarker crosstalk and disease prominence.
Table 1. Demographics of Healthy and Influenza Cohorts.
Table 2. Biomarker, Statistical, and Readability Metrics among Cohorts.
Figure 1. Scatter plots outlining the median and inter-quartile range of individual biomarker levels among healthy (gray, n=64) and influenza (red, n=38) cohorts.
Figure 2. Heat map visualization of influenza (“flu”) patient biomarker stratification at levels above (blue) or below (red) the healthy population cut-point (95th percentile).
Figure 3. Spearman correlation metrics of the Influenza cohort. (A-C) Individual scatter plots and resolved p-values of correlation for selected biomarkers or IFN score. (D) Contemplation of Spearman R values between paired biomarkers. Samples displaying a double negative response were omitted during Spearman analysis.
Conclusions
- IFN-Alpha and IFN-Omega are highly correlated in Influenza patient sera.
- CXCL-10 correlates well with IFN-Score in Influenza.
- Little or no IFN-Alpha, IFN-Beta, or IFN-Omega is detected in healthy donors.
- Larger cohorts with more complete patient information should provide more robust results.
- Initial small studies with Hepatitis B and C donors show no Type I IFN.
- Acute vs. chronic viral infection?
References
1. Llibre et al. Front. Cell Infect. Microbiol. 2019 Aug 22; 9:296. Alpha and Beta in Flu.
2. Pizzini et al. Influenza Other Respir. Viruses. 2019 Sep 6. Neopterin in Flu.
3. Hoffmann et al. Sci. Rep. 2016 Dec 6; 6:38532. IP-10, IFN-γ in Flu and Pneumonia.