Human Interleukin 22 ELISA designed for accurate quantitation of endogenous human IL-22 in healthy & disease sera/plasma, and tissue culture media samples with an LLOQ of 0.78 pg/ml. This assay measures unbound (free) IL-22. IL-22 Binding Protein (IL-22BP) may interfere with the assay if present at high concentrations.
Product Name: VeriKine-HS Human Interleukin 22 ELISA Kit
$675.00
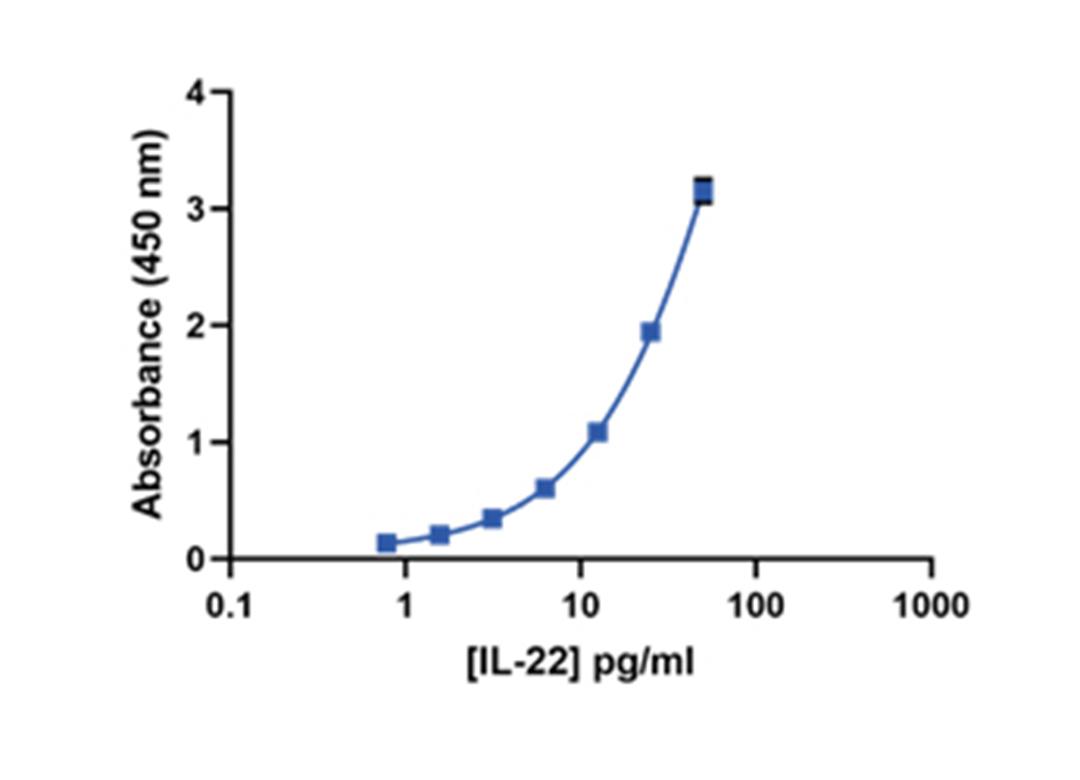
Representative Human IL-22 ELISA Standard Curve from 0.78 - 50 pg/ml (see Technical Data Sheet)
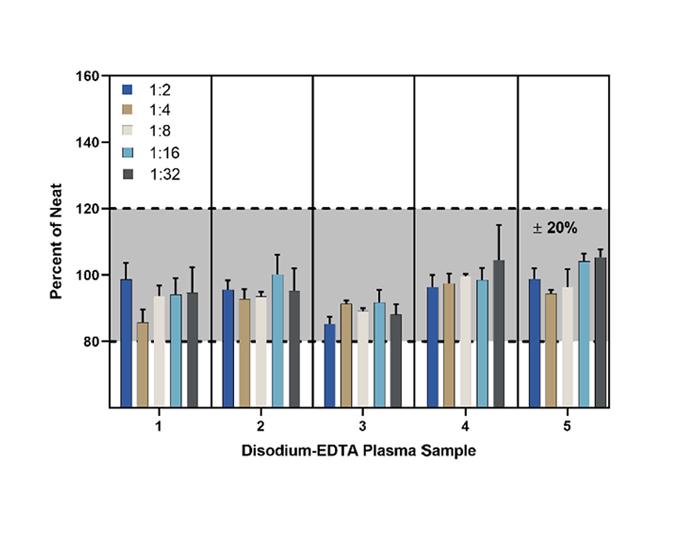
Linearity EDTA-Plasma Samples
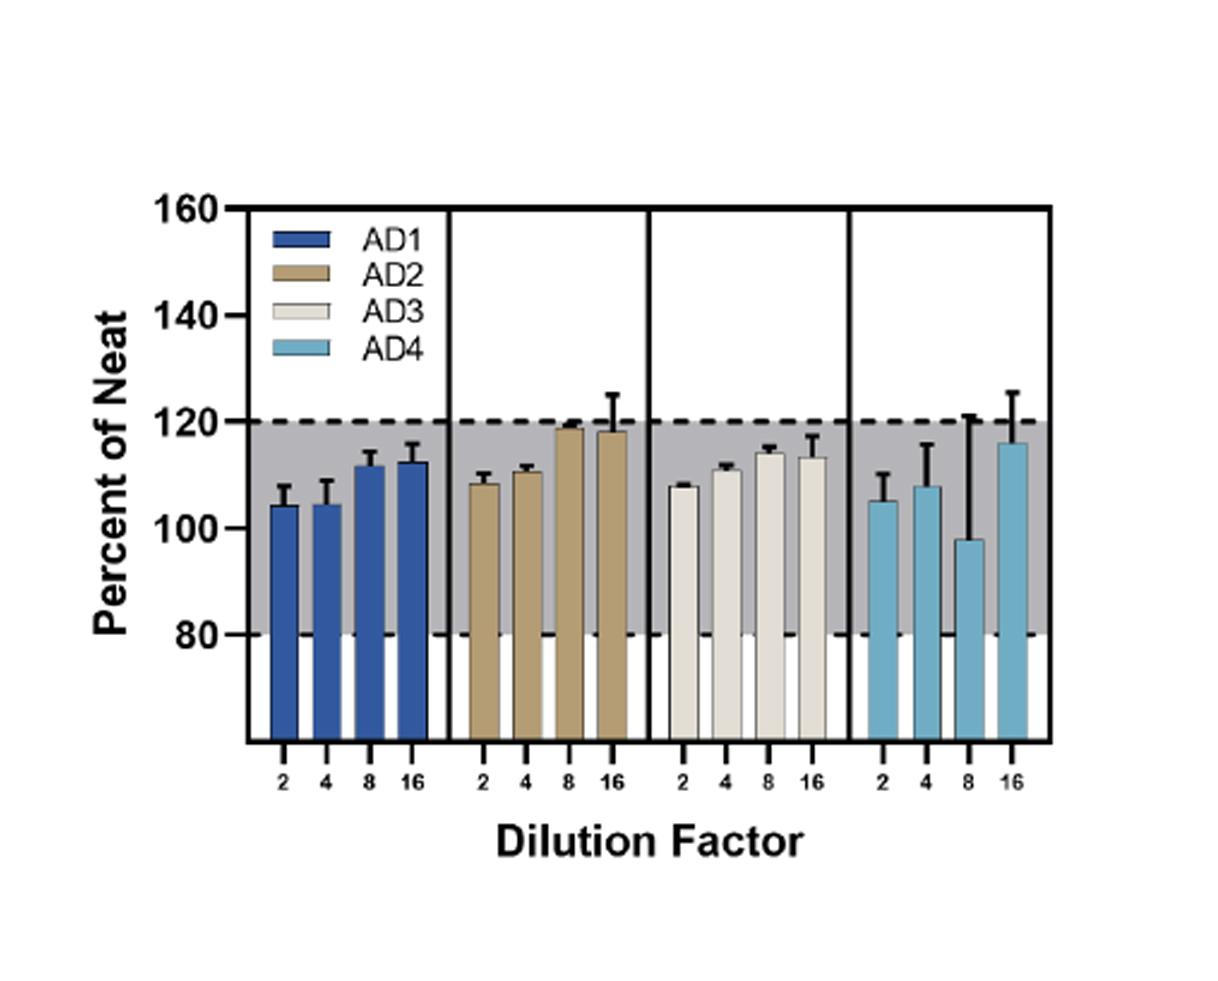
Parallelism of Disease Serum: Four Atopic Dermatitis (AD) sera with high endogenous IL-22 levels were assayed in duplicate for reliable quantitation after dilution. Samples were diluted down to 16-fold. All samples fell within 100+/-20% of neat of value.
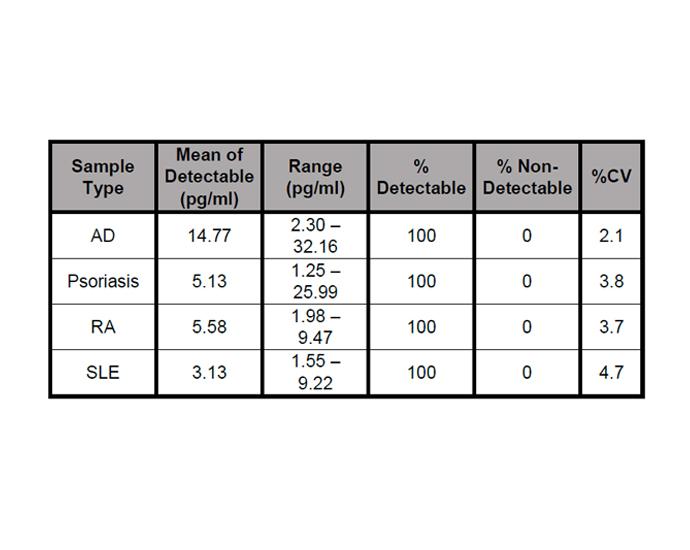
Forty serum samples from various diseased volunteers were assayed on PBL's 41701-1 kit. PBL's kit detected low & high endogenous levels in all 40 disease state samples. (AD=Atopic Dermatitis, RA=Rheumatoid Arthritis, SLE=Systemic Lupus Erythematosus)
PBL’s IL-22 ELISA is intended for quantification of IL-22 in Tissue Culture Media (TCM), and complex matrices such as serum and plasma. The high-affinity form of the IL-22 binding protein (IL22-BP) does inhibit this assay which suggests the ELISA may measure free IL-22 in samples.
Documentation
Certificate of Analysis (CoA) & Protocol, Safety Data Sheet (SDS)
Microplate reader capable of reading an OD at a wavelength of 450 nm
Variable volume microtiter pipettes
Adjustable multichannel pipette (50-300 μl)
Reagent reservoirs
Wash bottle or plate washing system
Distilled or deionized water
Serological pipettes (1, 5, 10 or 25 ml)
Disposable pipette tips (polypropylene)
Plate shaker
Representative Standard Curve in Standard Diluent
Human IL-22 standard curves were prepared in Standard Diluent (SD) and assayed in triplicate over nine runs. The figure below shows the dose response and absorbance values. Error bars indicate the standard deviation.
Intra-Assay Precision
Sample
1
2
3
4
n
18
18
18
18
Mean (pg/ml)
26..68
6.42
2.86
4.52
Standard Deviation
1.38
0.62
0.16
0.18
CV (%)
5.2
9.7
5.5
4.1
Inter-Assay Precision
Sample
1
2
3
4
5
n
5
5
5
5
5
Mean (pg/ml)
28.05
6.73
3.13
4.80
5.79
Standard Deviation
3.62
0.68
0.17
0.27
0.54
CV (%)
12.9
10.1
5.3
5.7
9.3
Intermediate Precision
Sample
1
2
3
4
5
n
27
27
27
27
27
Mean (pg/ml)
31.93
7.76
3.43
5.30
6.45
Standard Deviation
4.34
1.24
0.24
0.62
0.94
CV (%)
13.6
16.0
12.3
11.8
14.6
Spike Recovery
TCM
Disodium-EDTA Plasma
Serum
Spike Sample
1
2
3
Target Conc. (pg/ml)
100
25
5
Mean Recovery
101.9
93.9
90.8
Range (%)
100.7-103.0
90.3-97.5
90.2-91.4
Spike Sample
1
2
3
Target Conc. (pg/ml)
100
25
5
Mean Recovery
97.3
88.7
83.9
Range (%)
87.6-102.6
82.0-93.3
76.1-92.5
Spike Sample
1
2
3
Target Conc. (pg/ml)
100
25
5
Mean Recovery
90.9
87.1
84.8
Range (%)
83.3-100.5
80.0-98.9
74.6-94.5
Representative Standard Curves in Various Matrices
Percent Recovery of IL-22 in Various Matrices
Parallelism of Normal Human Serum (NHS)
Three NHS samples with high levels of endogenous IL-22 were assayed in duplicate to assess reliable quantification after dilution within the standard curve range. Endogenous samples were diluted in Standard Diluent down to a 16-fold dilution. All samples fell within 100 ± 20% of the neat value. Error bars indicate the standard deviation.
Parallelism of Disease State Serum
Four Atopic Dermatitis (AD) serum samples with high levels of endogenous IL-22 were assayed in duplicate to assess reliable quantification after dilution within the standard curve range. Samples were diluted in Standard Diluent (SD) down to a 16-fold dilution. All samples fell within 100 ± 20% of the neat value. Error bars indicate the standard deviation.
Linearity of NHS
Linearity of Disodium-EDTA Plasma
Linearity of Na-Heparin Plasma
Representative Standard Curves of PBL and Competitor A
PBL’s and Competitor A’s standards were assayed on the 41701 PBL ELISA. Figure 13 shows the dose response curves and absorbance values in Standard Diluent (SD). Competitor A’s standard exhibits a lower dose response compared to PBL’s standard, as well as a lower percent recovery, which is less than 80% of the expected value. Competitor A’s standard curve demonstrated less sensitivity than PBL’s IL-22 ELISA.
Comparison of Percent Recovery Curves of PBL and Competitor A
Curves The figure below shows the recovery of the individual IL-22 standards at various concentrations. Competitor A’s standard was backfitted against PBL human cell-expressed standard, which was used to interpolate the concentrations of IL-22 and calculate the percent recovery of the curves from the expected value. PBL’s ELISA exhibited higher percent recovery than Competitor A.
PBL’s IL-22 ELISA (41701) Standard Curve in the Presence of IL22-BP
Competitor A’s Standard Curve in the Presence of IL22-BP
PBL’s IL-22 ELISA (41701) Recovery in the Presence of IL22-BP
Competitor A's Recovery in the Presence of IL22-BP
Sample Type
Mean of Quantified (pg/ml)
Range (pg/ml)
% Quantified
%Non-Quantified
% CV
Healthy Donor Readability on PBL's ELISA
NHS
1.84
0.80 - 5.43
96
(23/24)
4
5.6
Sodium-Citrate Plasma
2.54
1.06 - 24.60
100
(7/7)
0
4.5
Sample Type
Mean of Quantified (pg/ml)
Range (pg/ml)
% Quantified
%Non-Quantified
% CV
Healthy Donor Readability on Competitor A's ELISA
NHS
20.43
16.26 - 24.60
8
(2/24)
92
2.8
Sodium-Citrate Plasma
ND
ND
0
100
ND
ND: Not Detectable
Sample Type
Mean of Quantified (pg/ml)
Range (pg/ml)
% Quantified
%Non-Quantified
% CV
Disease State Readability on PBL's ELISA
AD
14.77
2.30 - 32.18
100
0
2.1
Psoriasis
5.33
1.25 - 25.99
100
0
3.8
RA
5.58
1.98 - 9.47
100
0
3.7
SLE
3.13
1.55 - 9.22
100
0
4.7
Sample Type
Mean of Quantified (pg/ml)
Range (pg/ml)
% Quantified
%Non-Quantified
% CV
Disease State Readability on Competitor A's ELISA
AD
32.42
14.28 - 73.07
60
40
5.0
Psoriasis
33.09
N/A
10
90
2.9
RA
ND
ND
0
100
ND
SLE
ND
ND
0
100
ND
Background
IL-22 is a member of the IL-10 family of cytokines1. Other names include IL-TIF and Zcyto18. IL-22 is produced by a variety of cells including Th1, Th17, Th22 T-cells, NKT cells, ILC3, neutrophils and macrophages2. Targeting primarily non-hemopoietic cells such as stromal and epithelial cells, IL-22 exerts both protective effects, such as hepatocyte and epithelial cell survival, and pro-inflammatory effects. It is also implicated in autoimmune diseases such as Systemic Lupus Erythematosus, Rheumatoid Arthritis and Psoriasis3. IL-22 is often considered a hallmark of IL-17 driven immune responses4.
The Total Human Interleukin 15 ELISA measures endogenous human IL-15 at or near basal levels with LLOQ of 0.51 pg/ml in serum, plasma, and cell culture media. This ELISA detects both free and bound forms of IL-15 (IL-15/IL-15R complex). Product Name: VeriKine-HS Total Human Interleukin 15…
 Powered by Bioz