The Total Human Interleukin 15 ELISA measures endogenous human IL-15 at or near basal levels with LLOQ of 0.51 pg/ml in serum, plasma, and cell culture media. This ELISA detects both free and bound forms of IL-15 (IL-15/IL-15R complex).
Product Name: VeriKine-HS Total Human Interleukin 15 ELISA Kit
$675.00
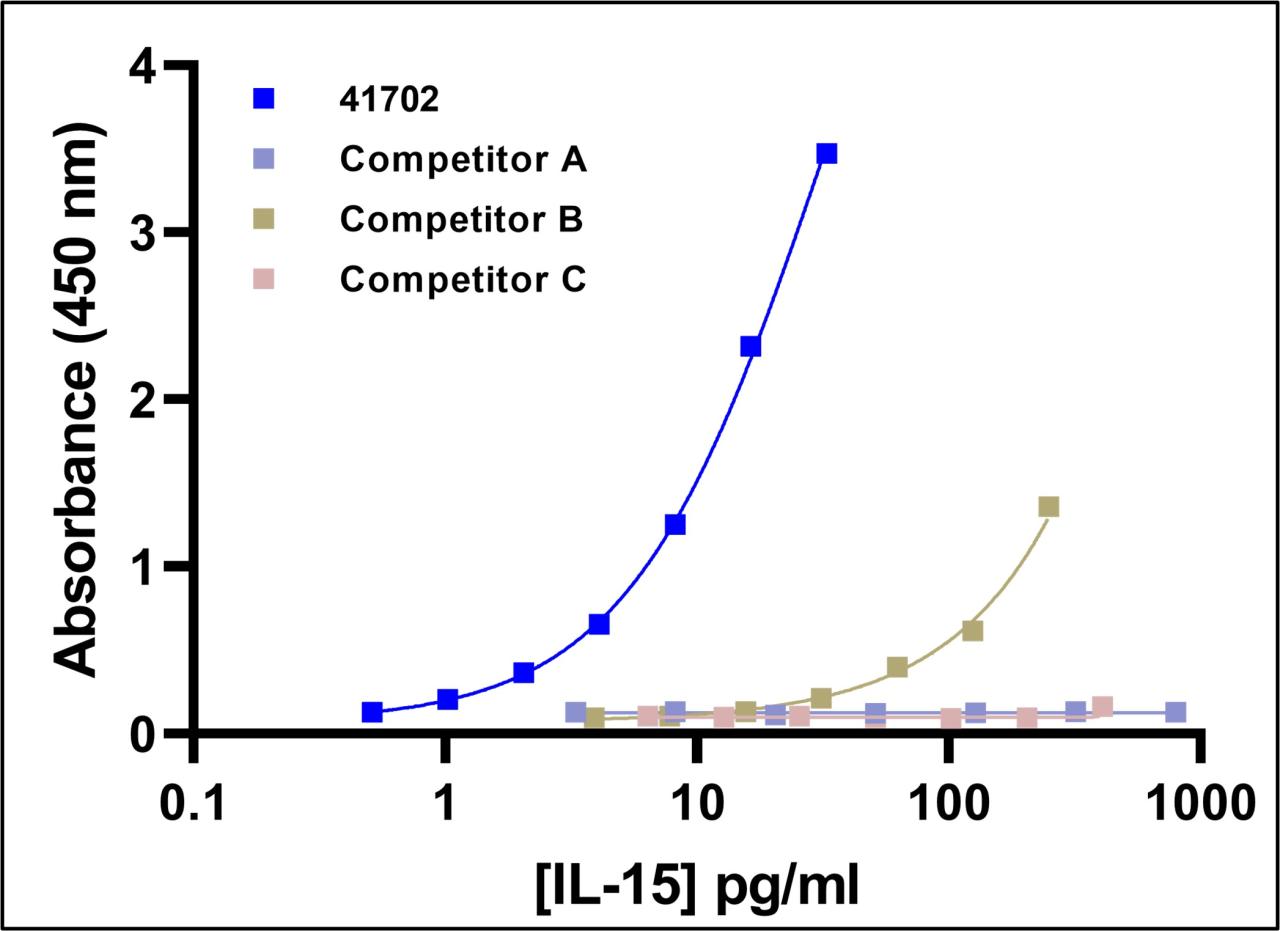
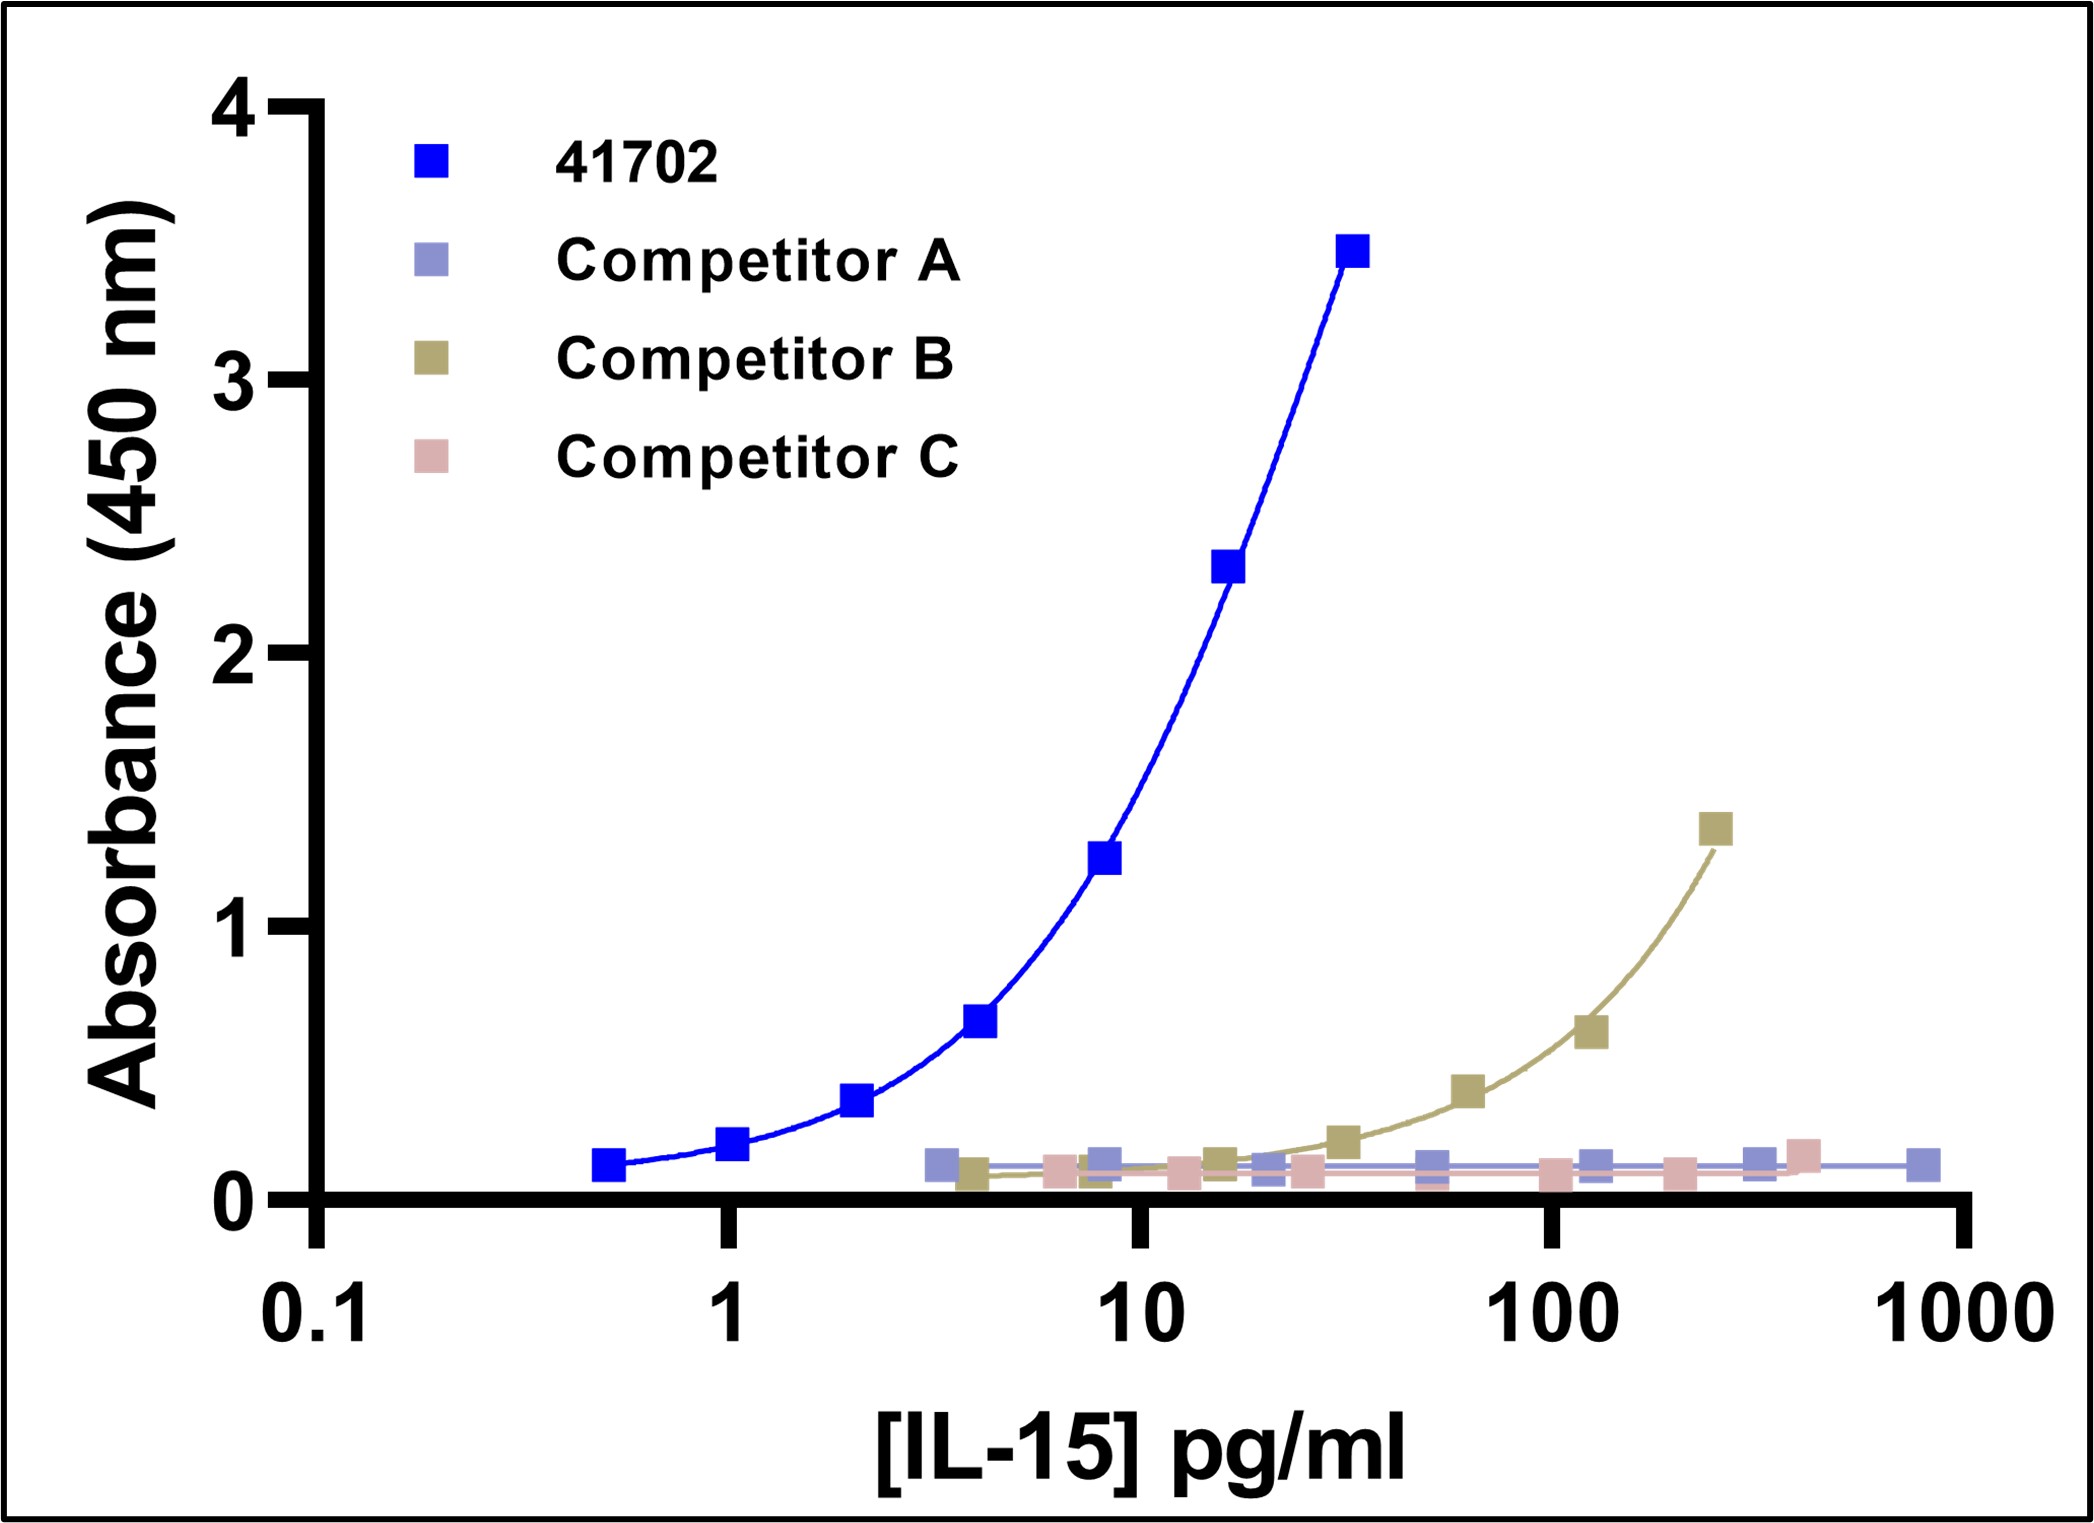
Comparison on Measuring Human IL-15/IL-15R Complex (see Technical Data Sheet).
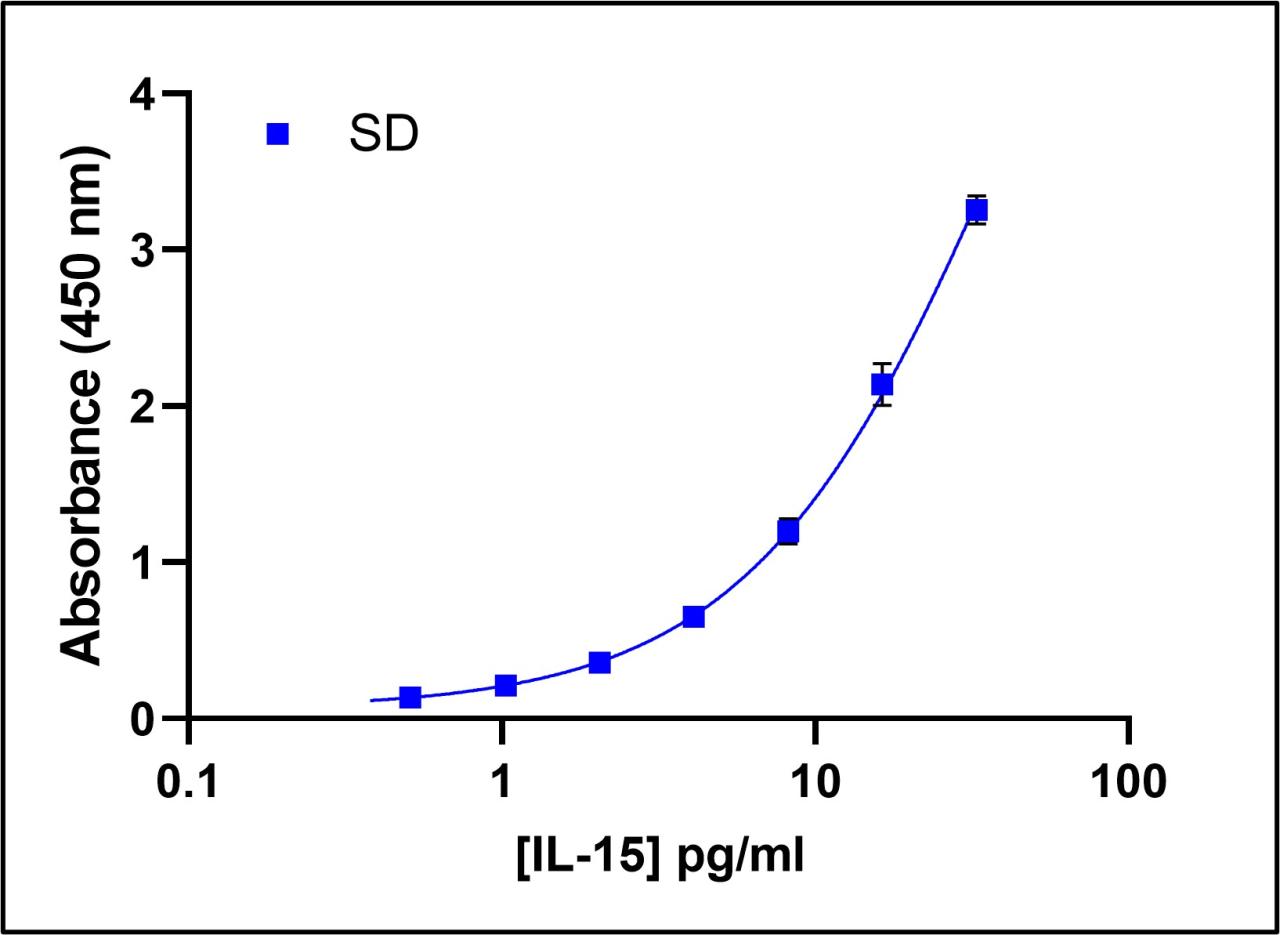
Representative Standard Curve in Standard Diluent (see Technical Data Sheet)
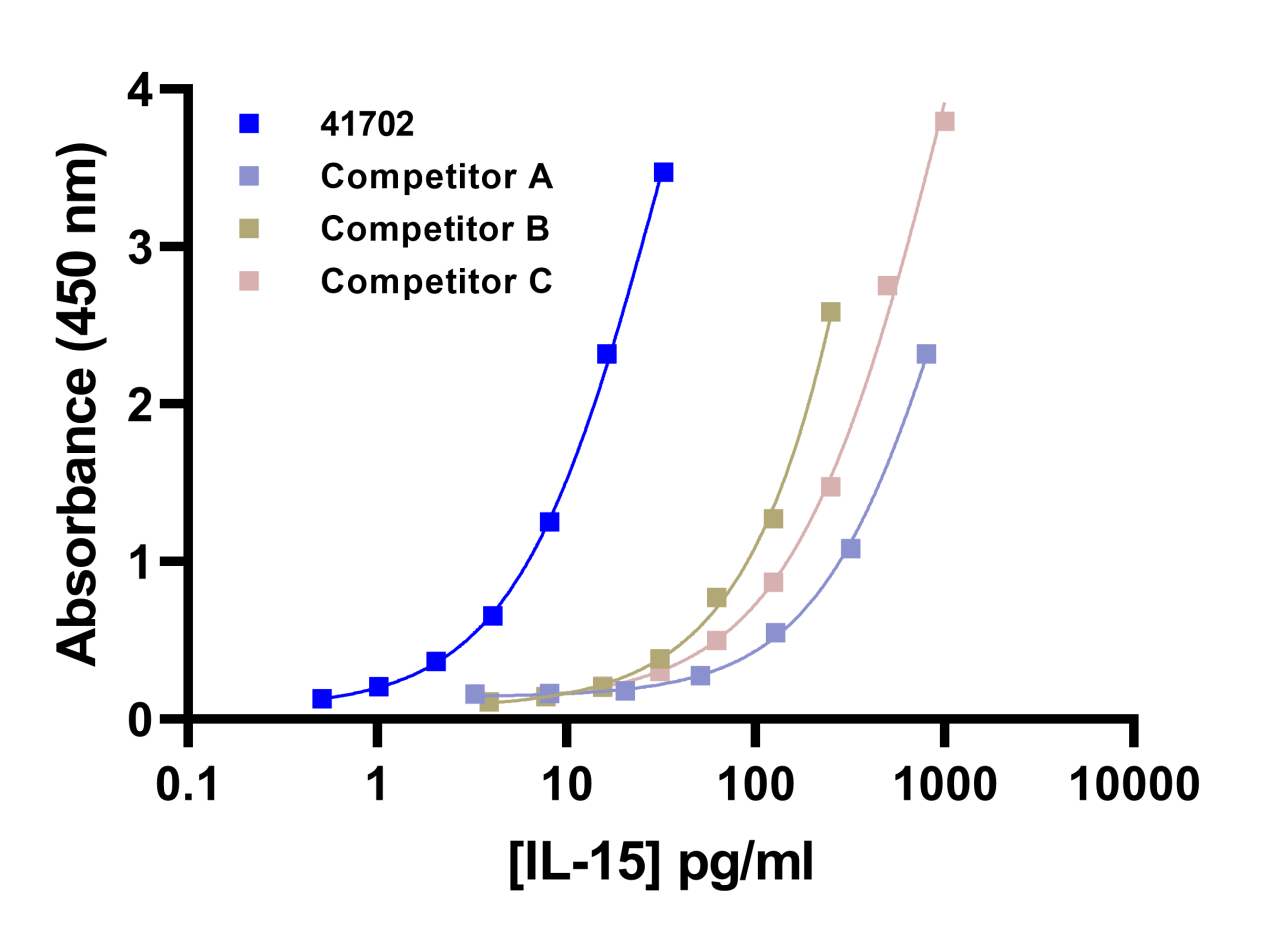
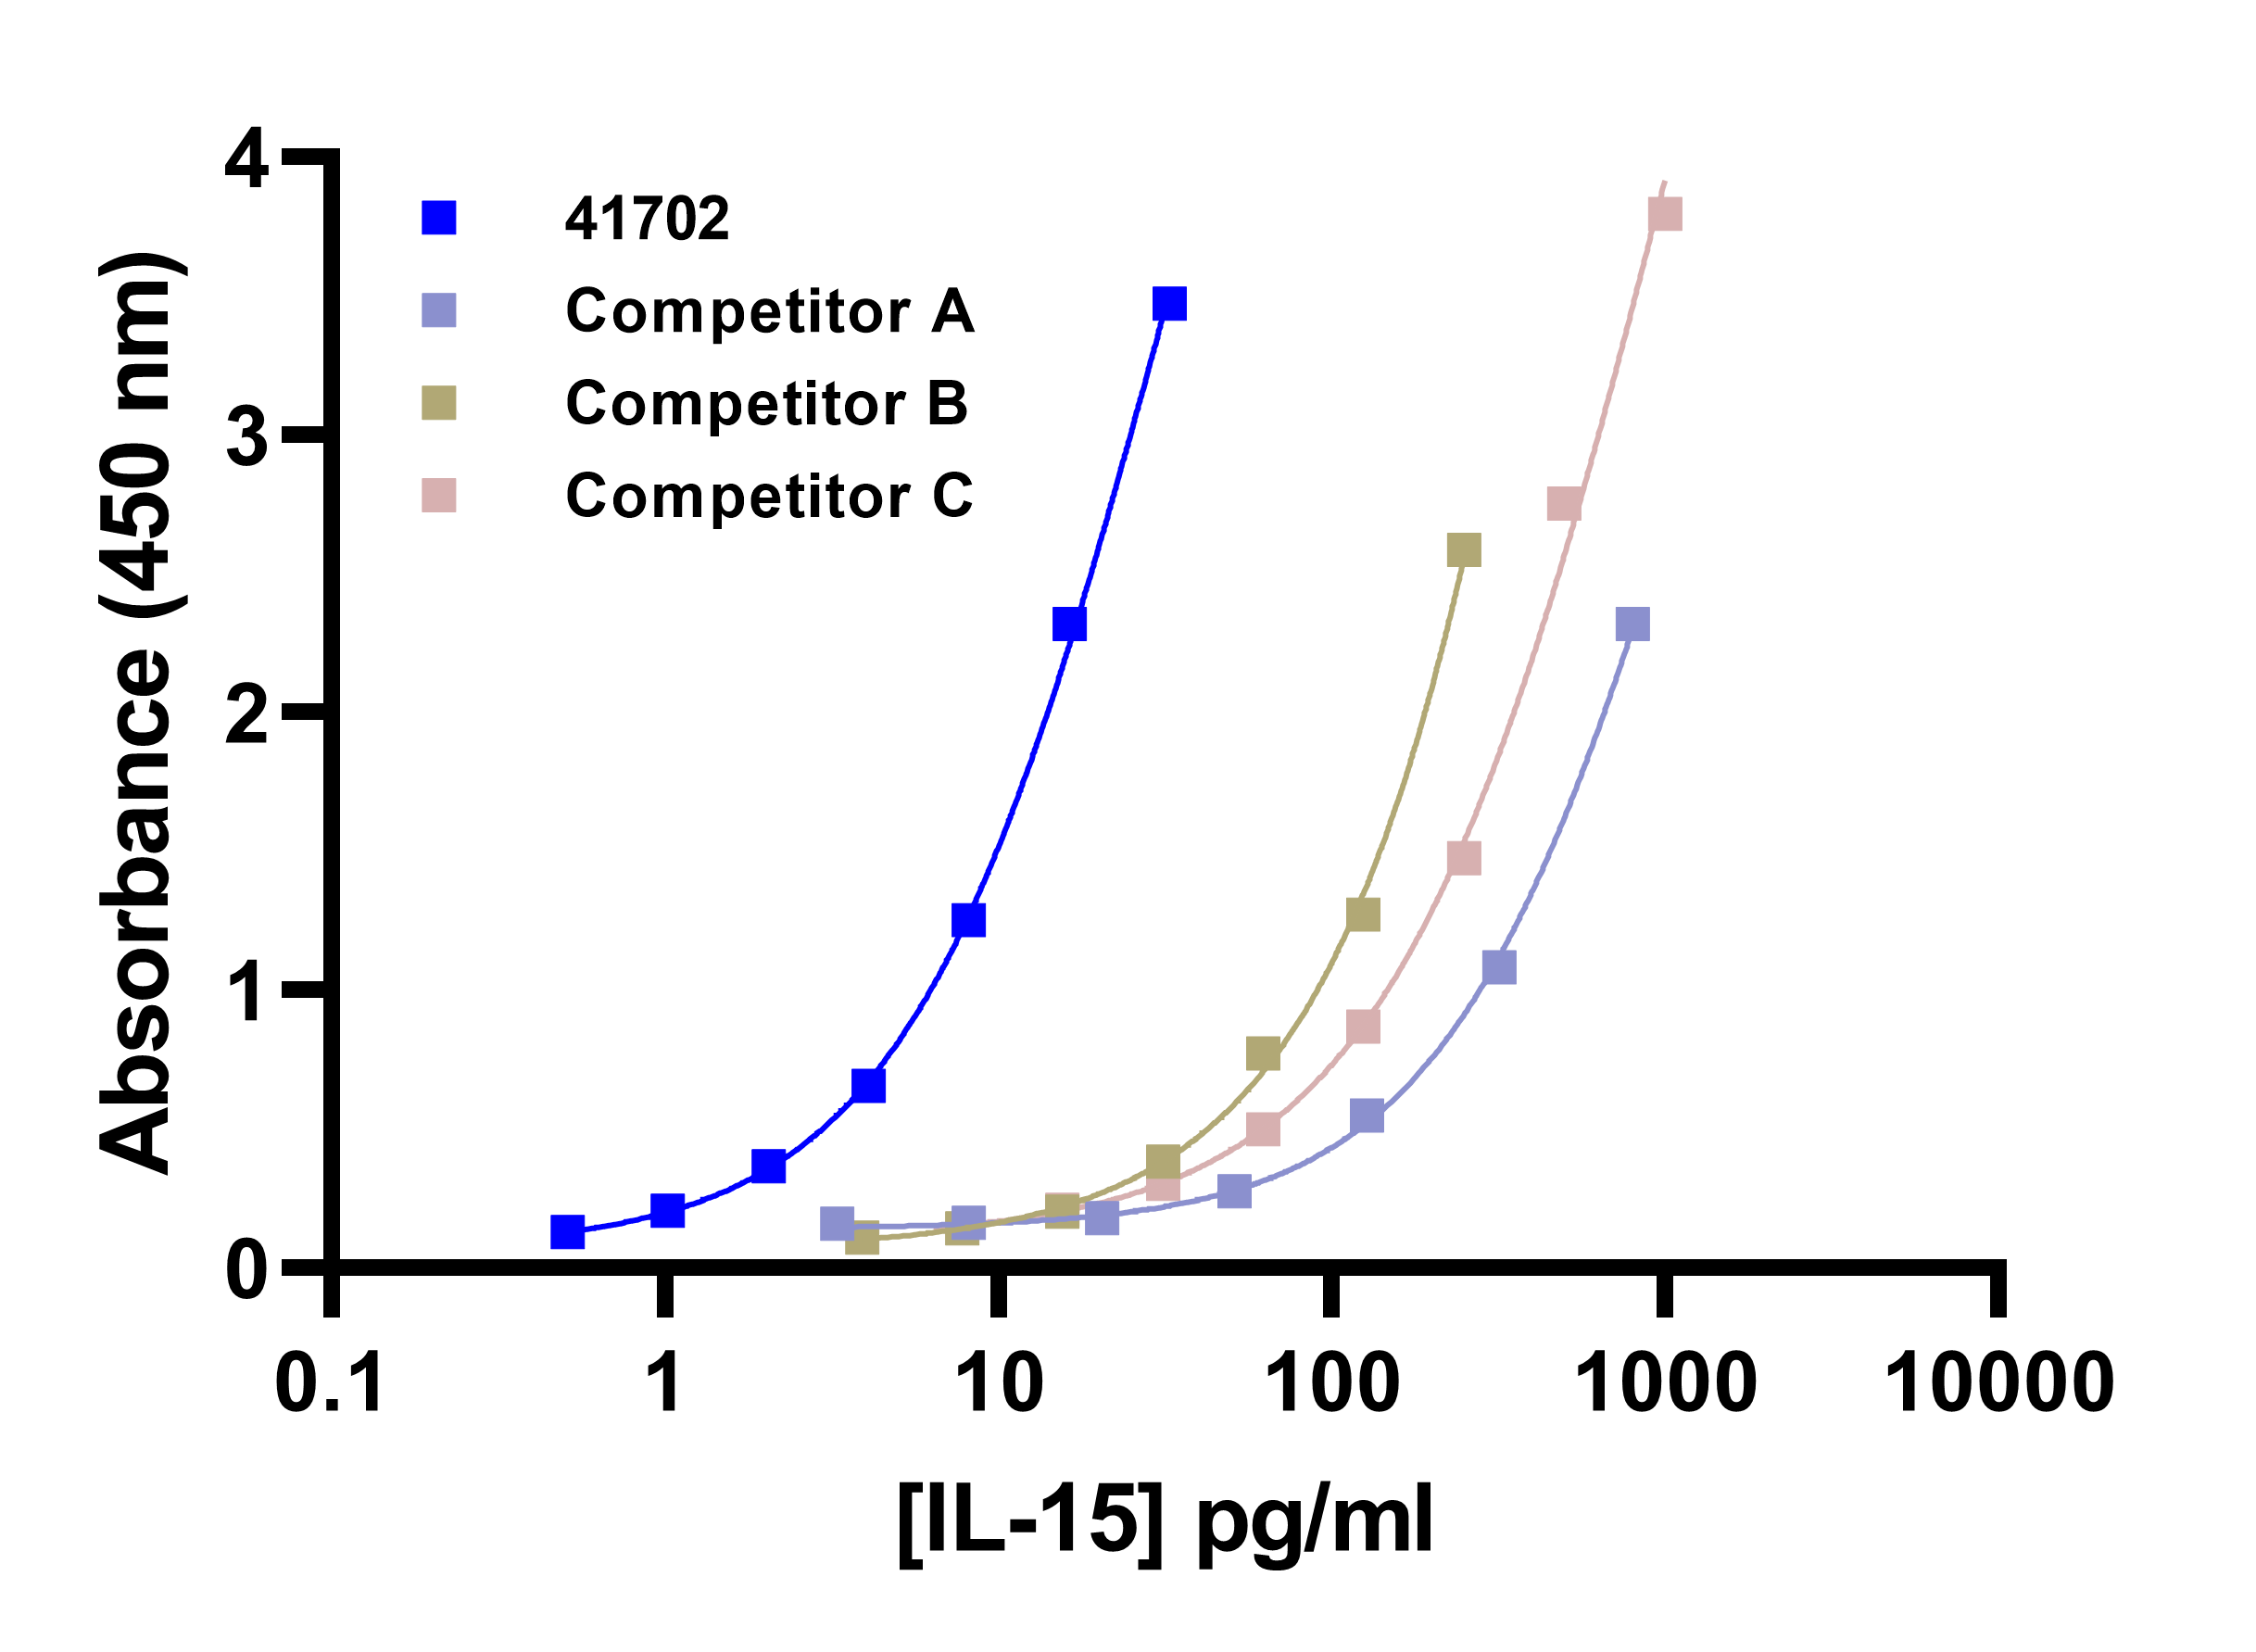
PBL's Total Human IL-15 ELISA Exhibits Greater Sensitivity than Competitive IL-15 Standards (see Technical Data Sheet)
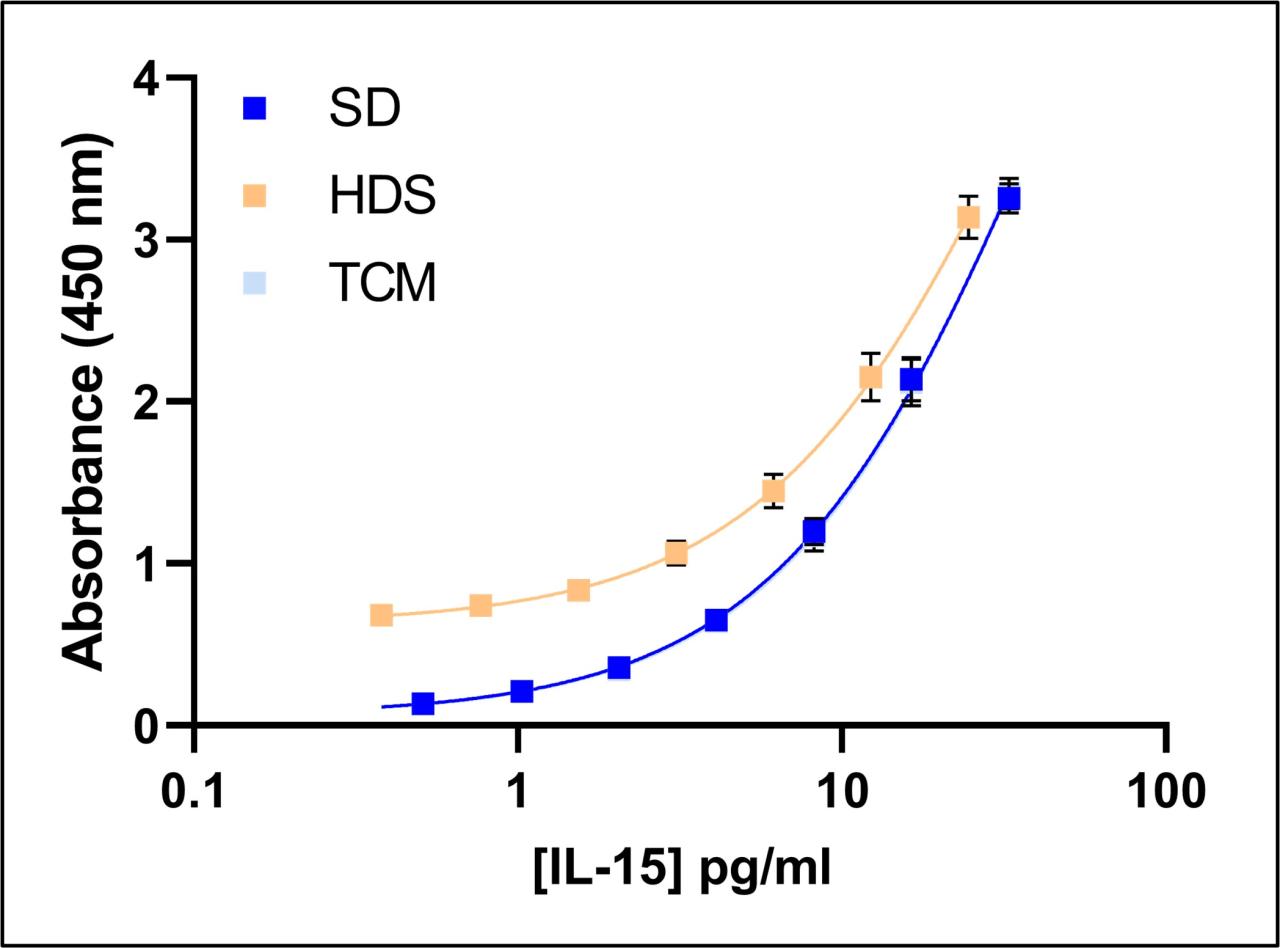
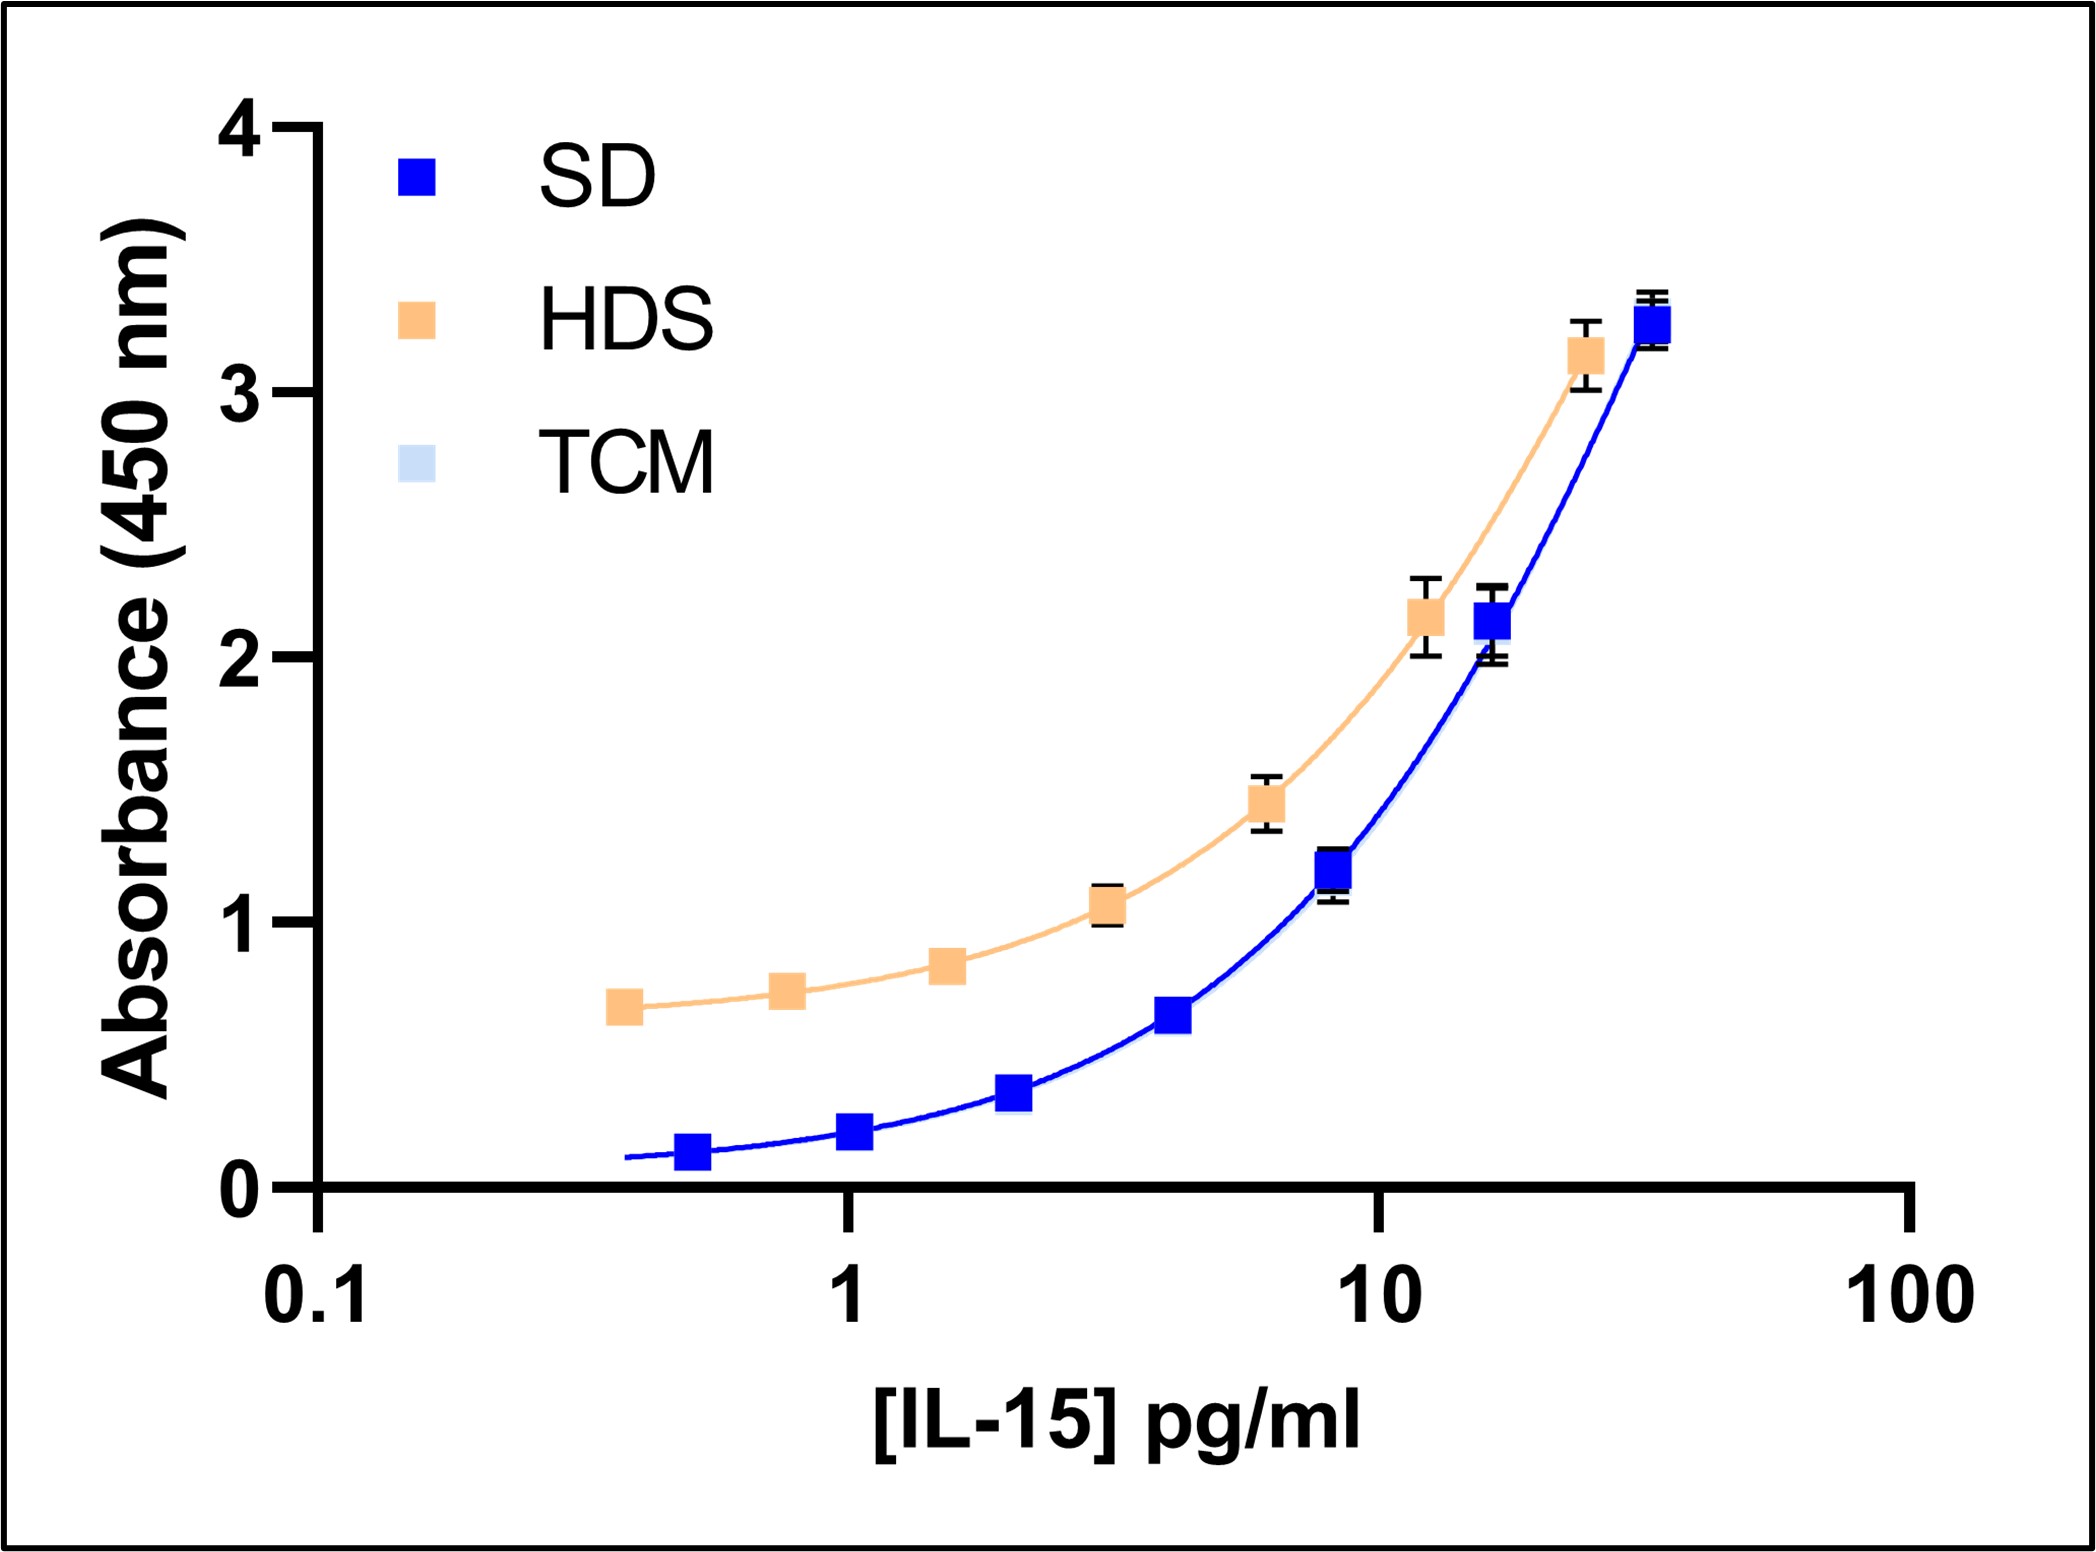
Representative Standard Curves in Various Matrices (see Technical Data Sheet)
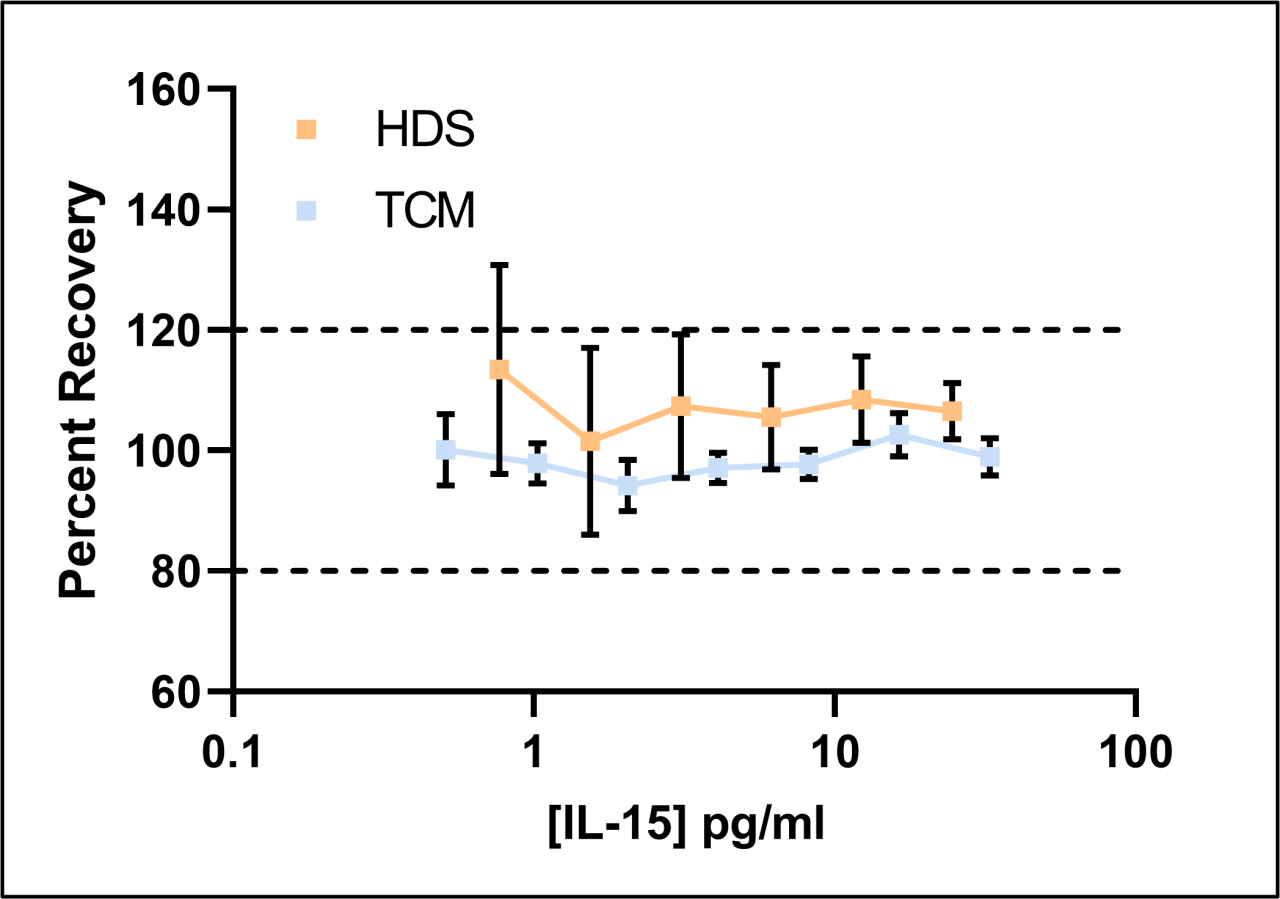
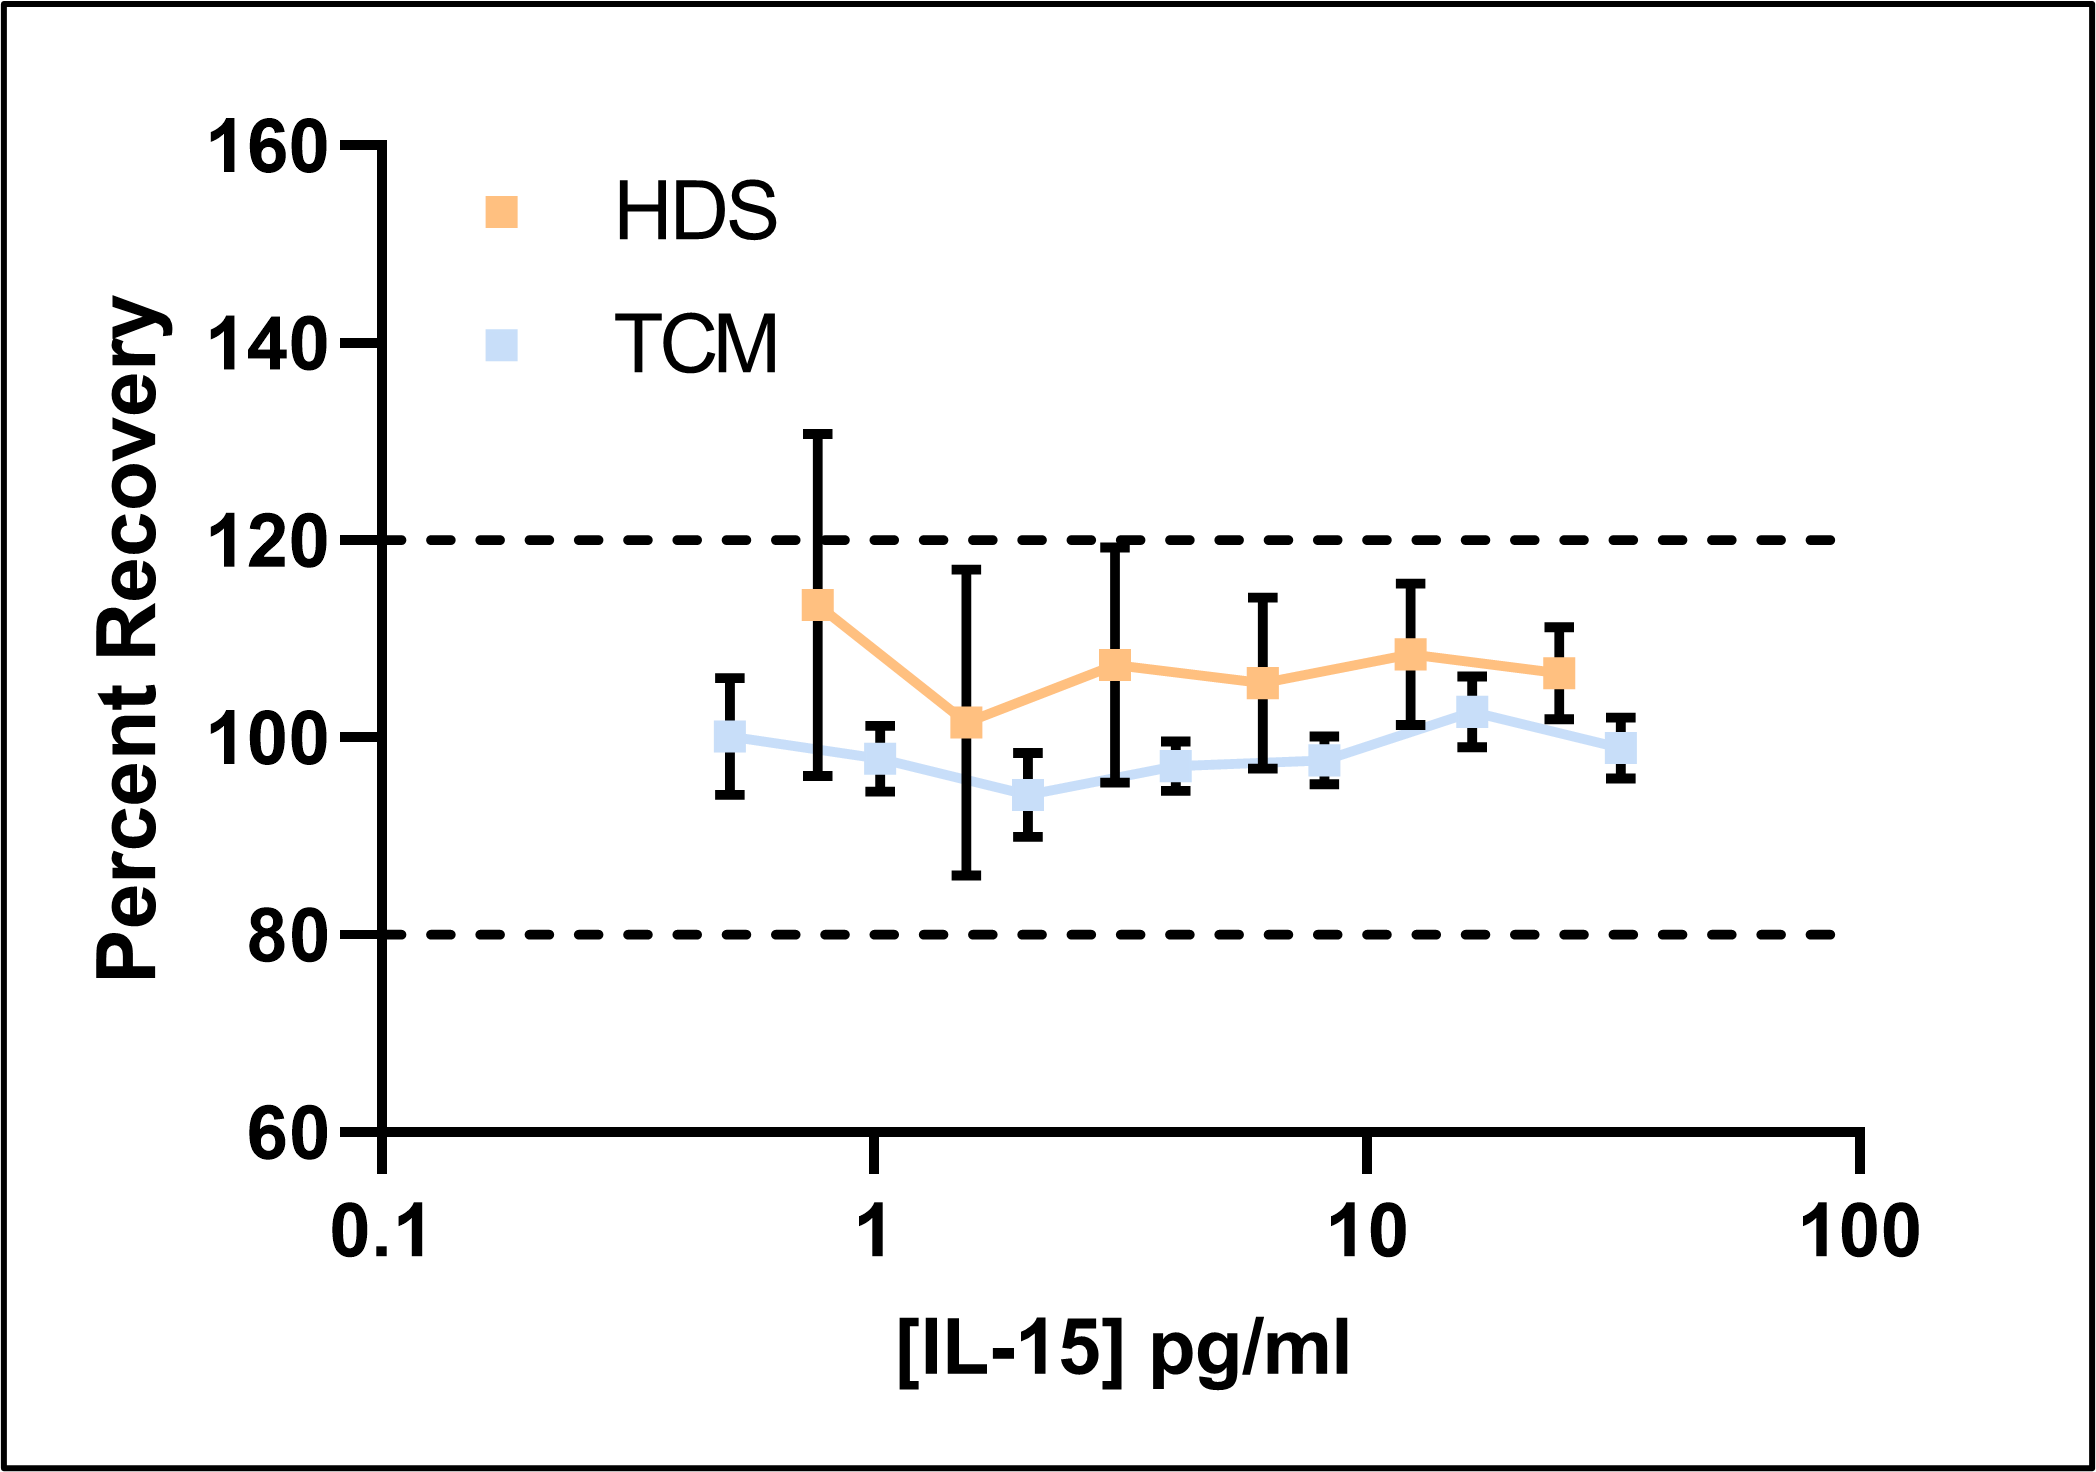
Percent Recovery of IL-15 in Various Matrices (see Technical Data Sheet)
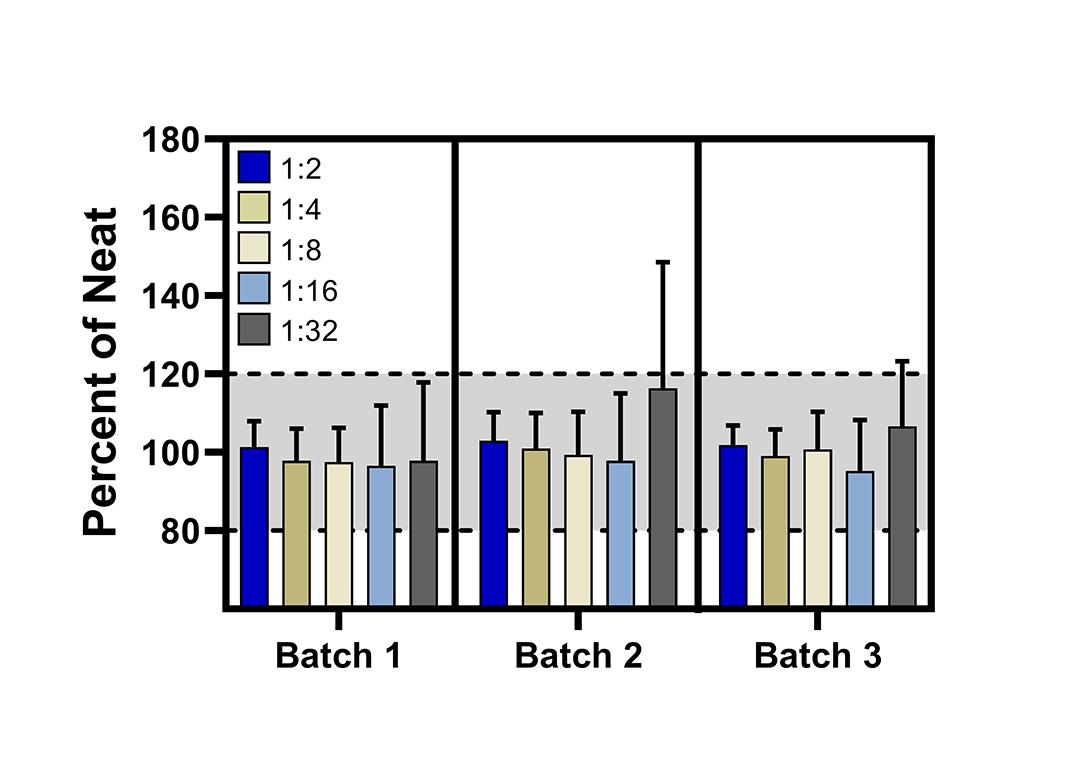
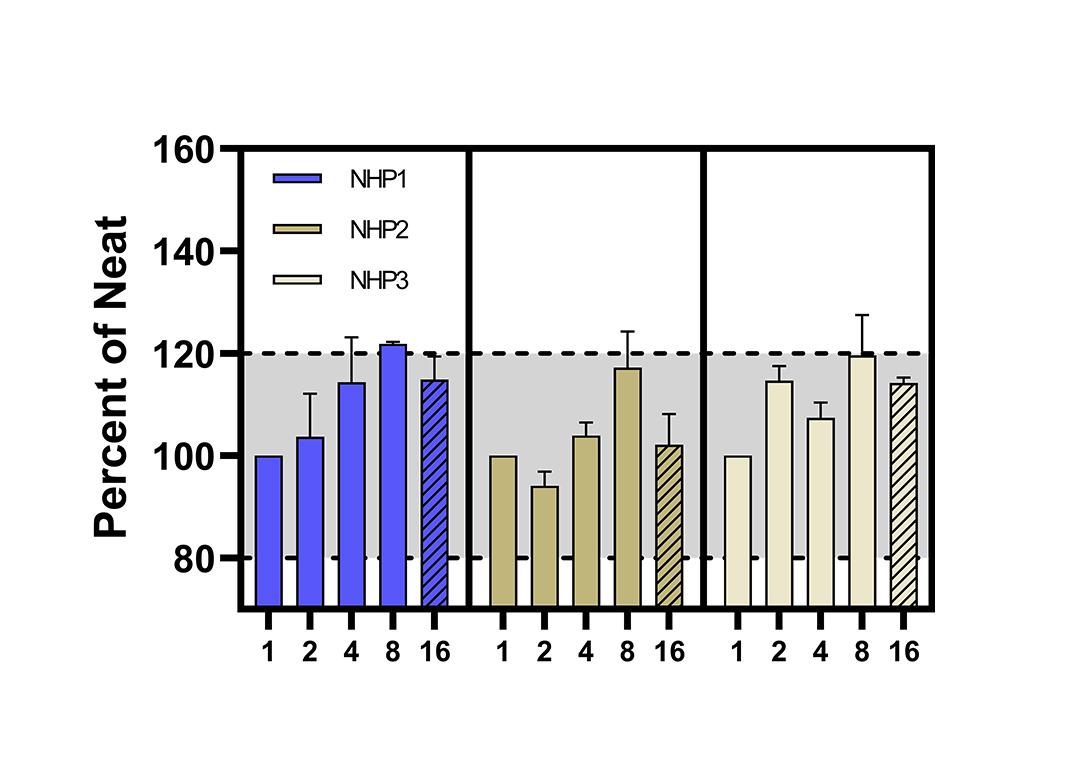
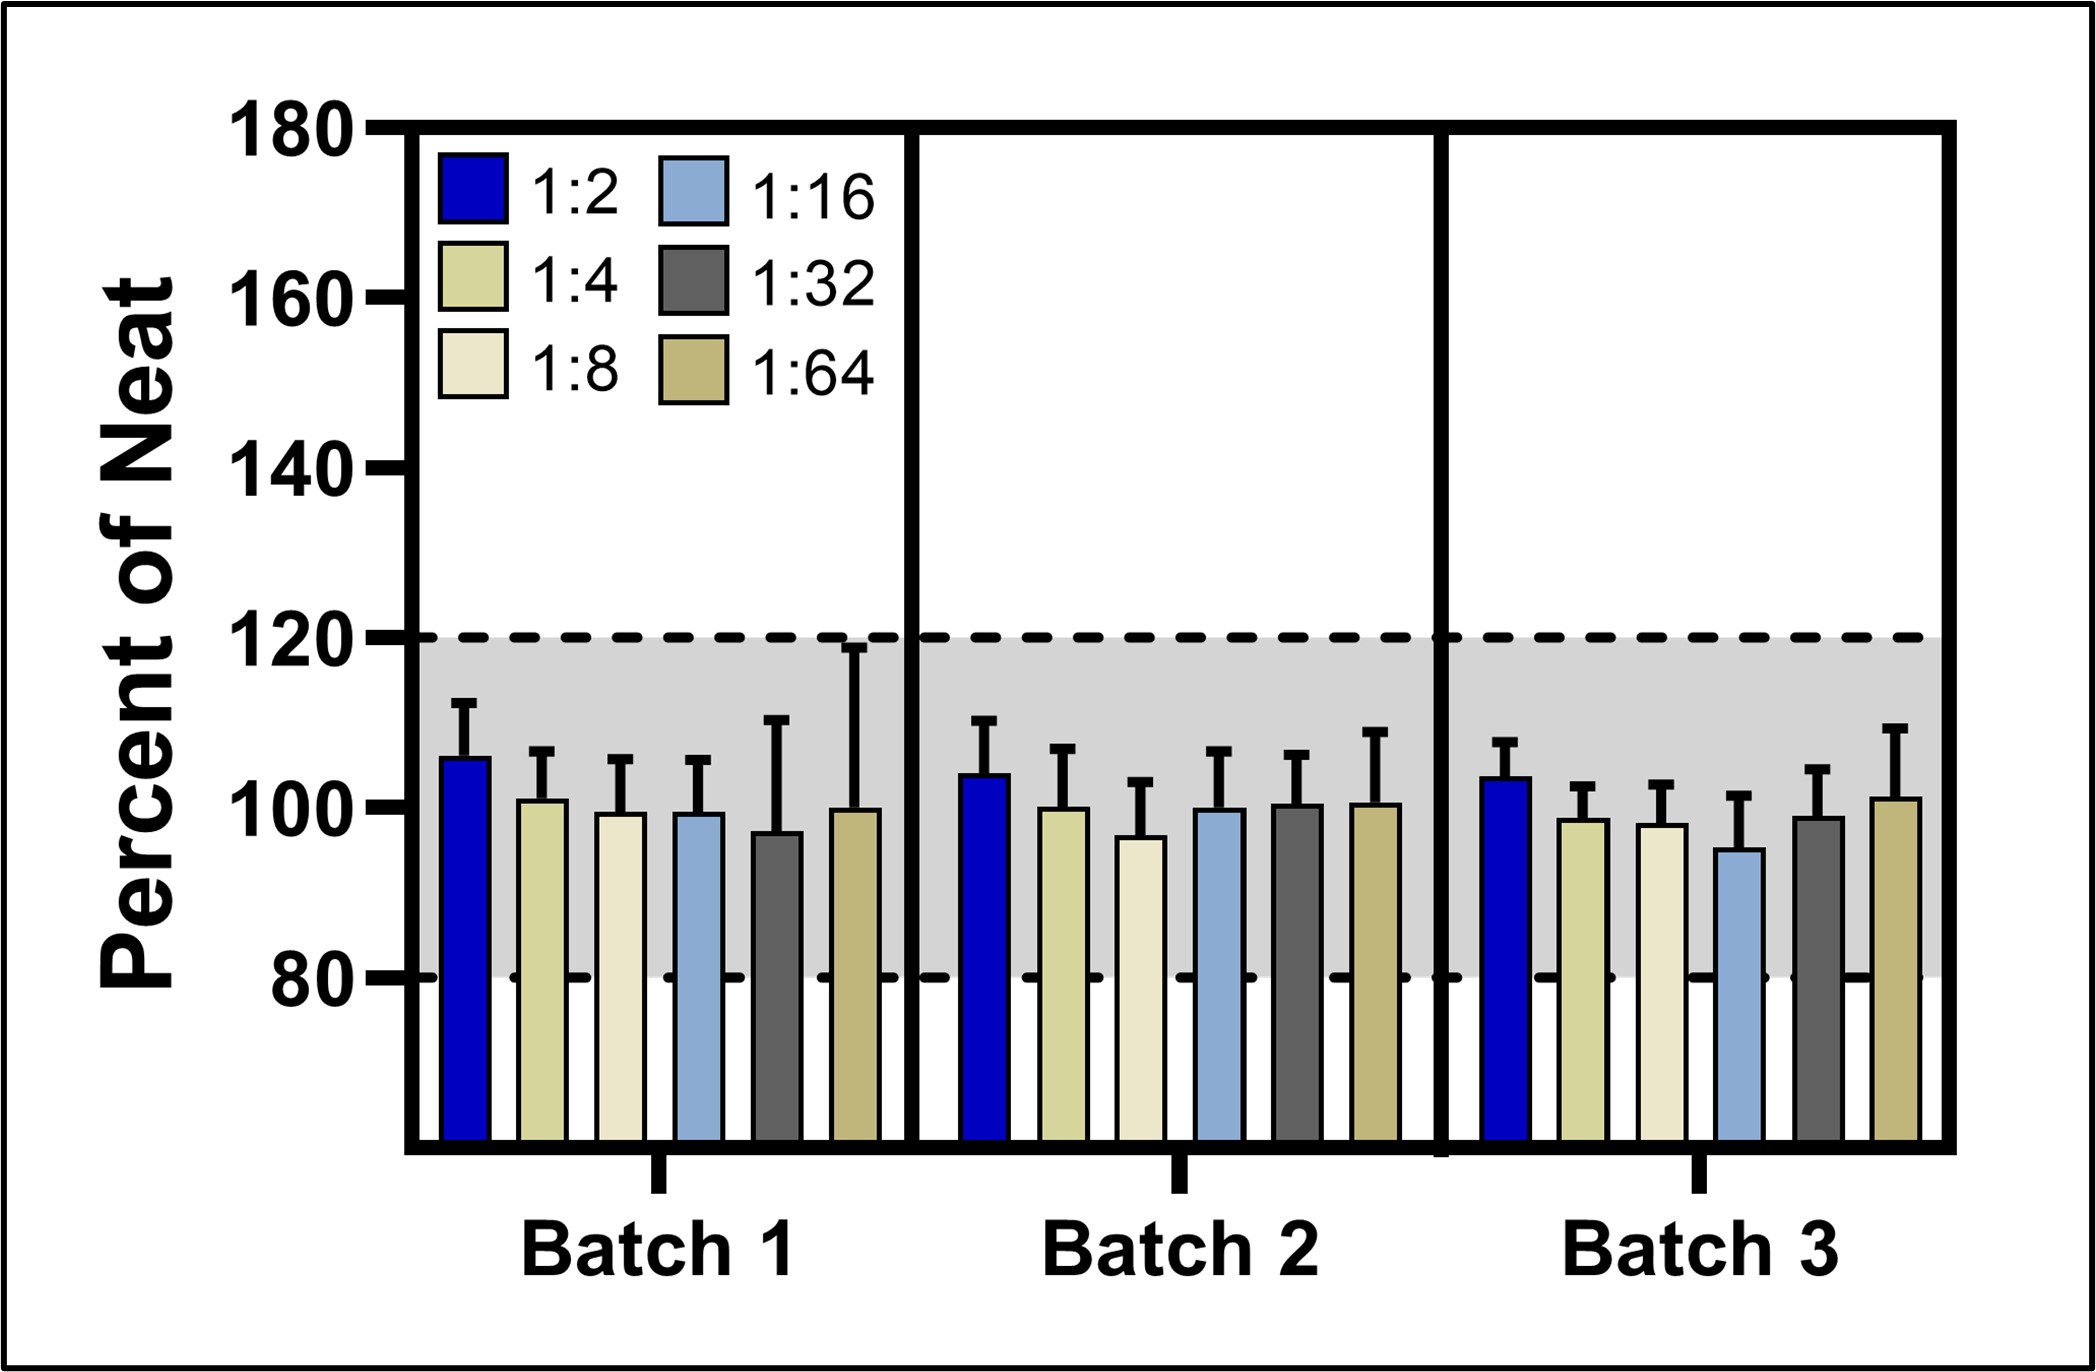
Total Human IL-15 ELISA Normal Human Serum (NHS) Linearity (see Technical Data Sheet)
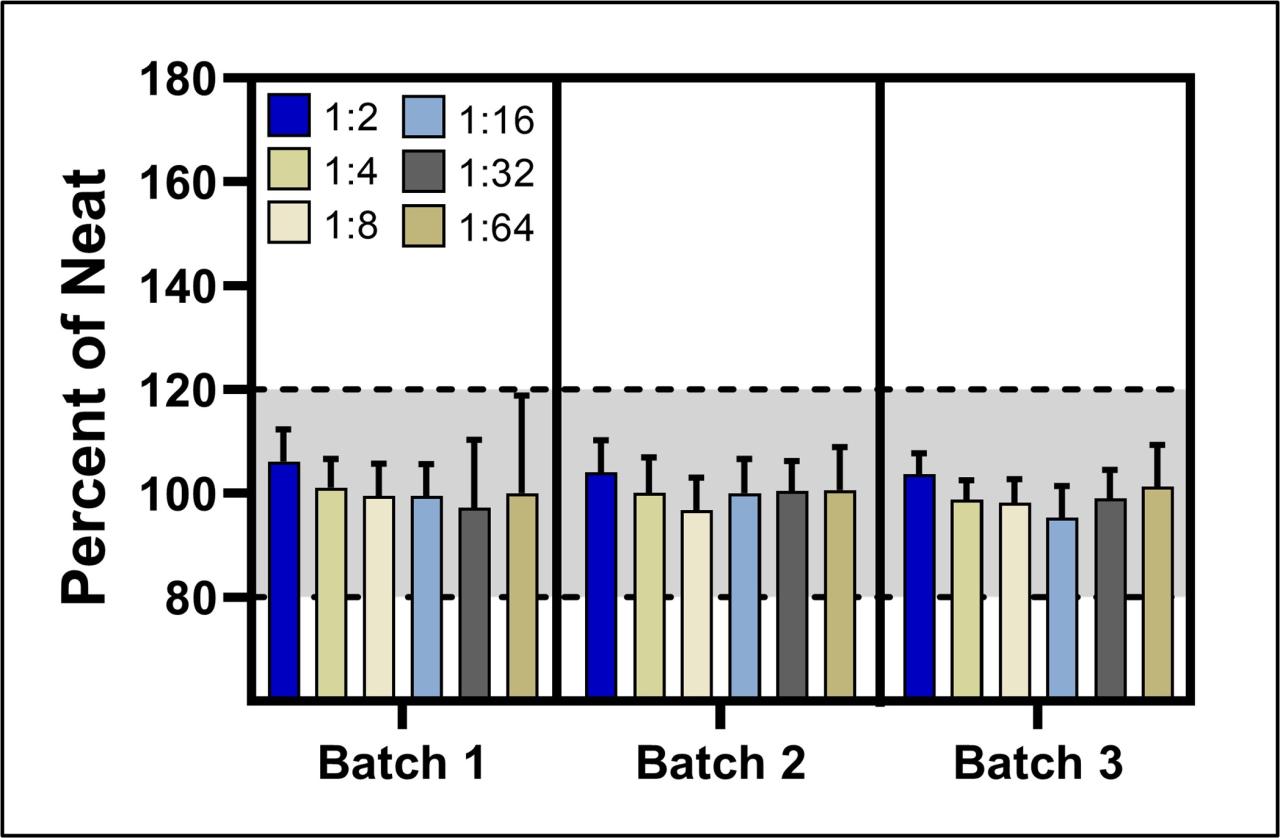
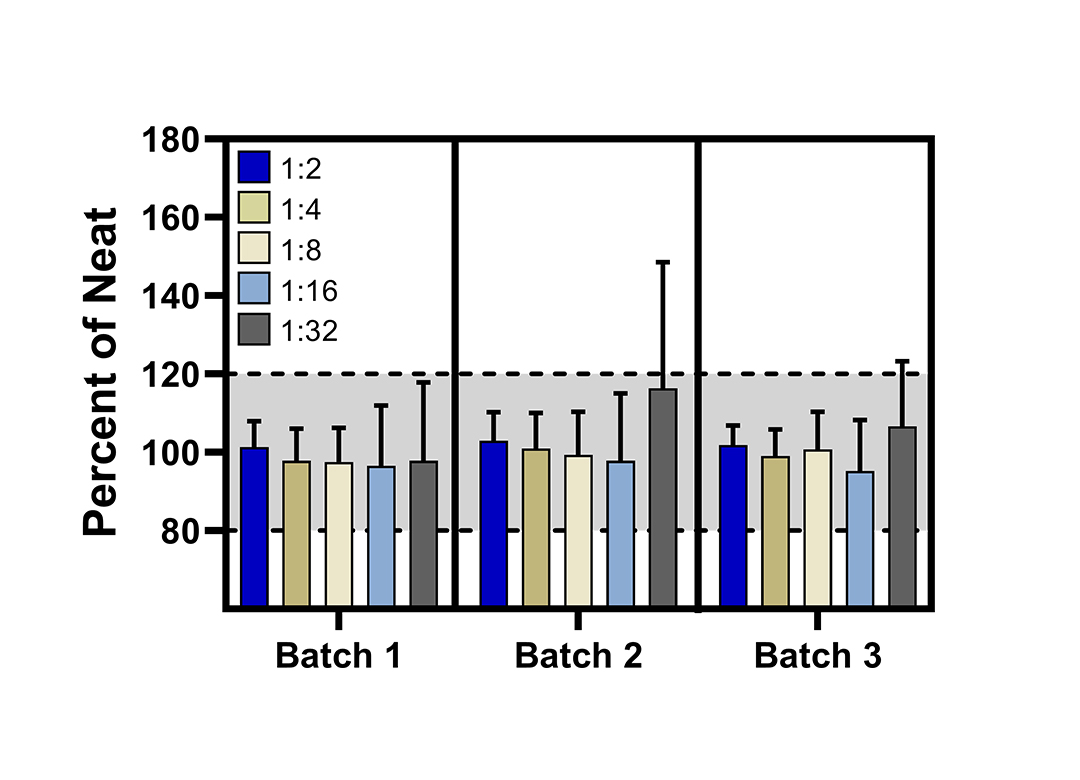
Linearity in Tissue Culture Media (TCM) (see Technical Data Sheet)
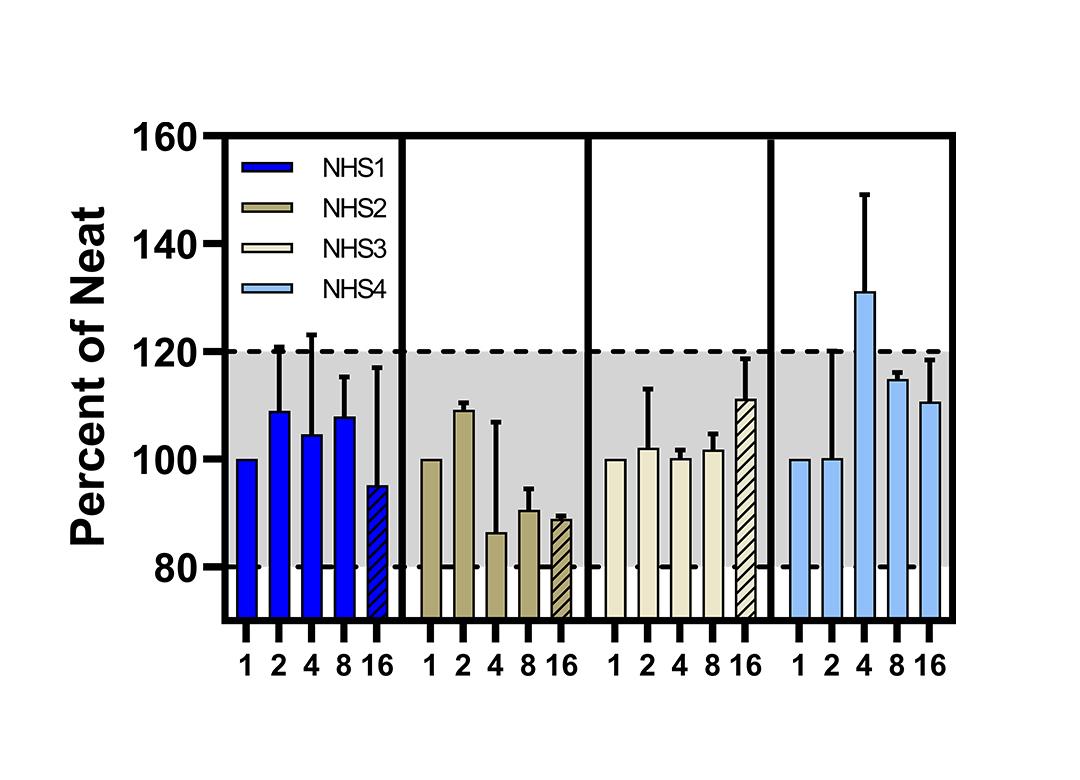
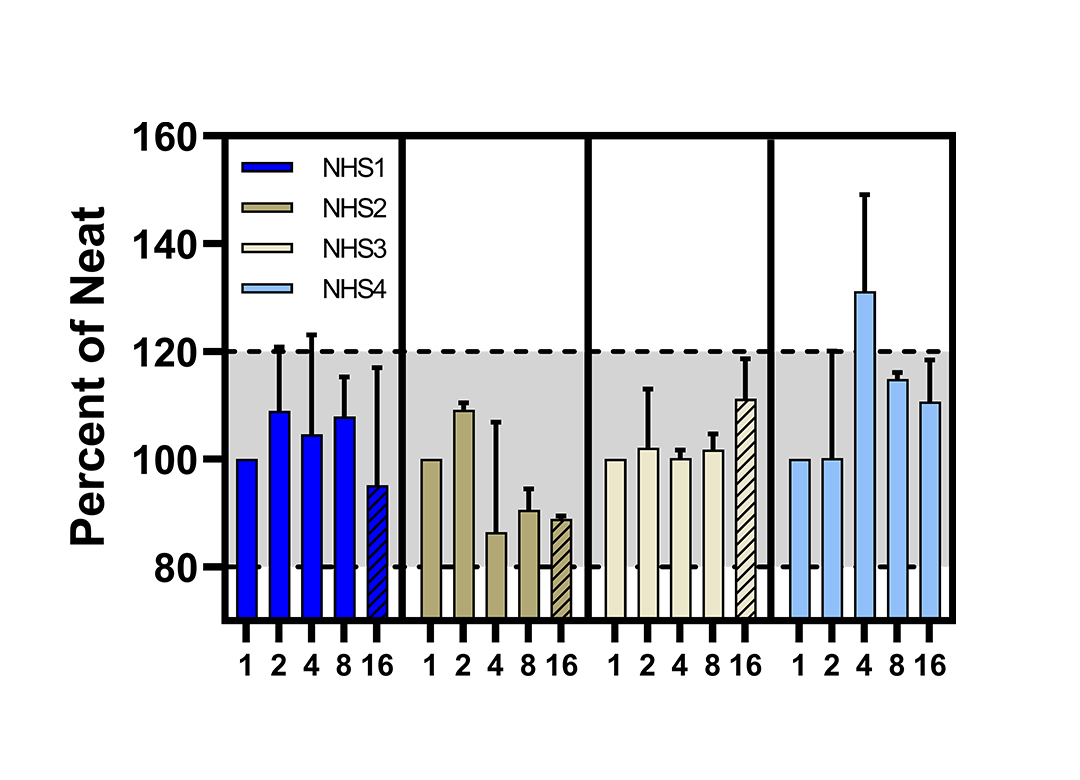
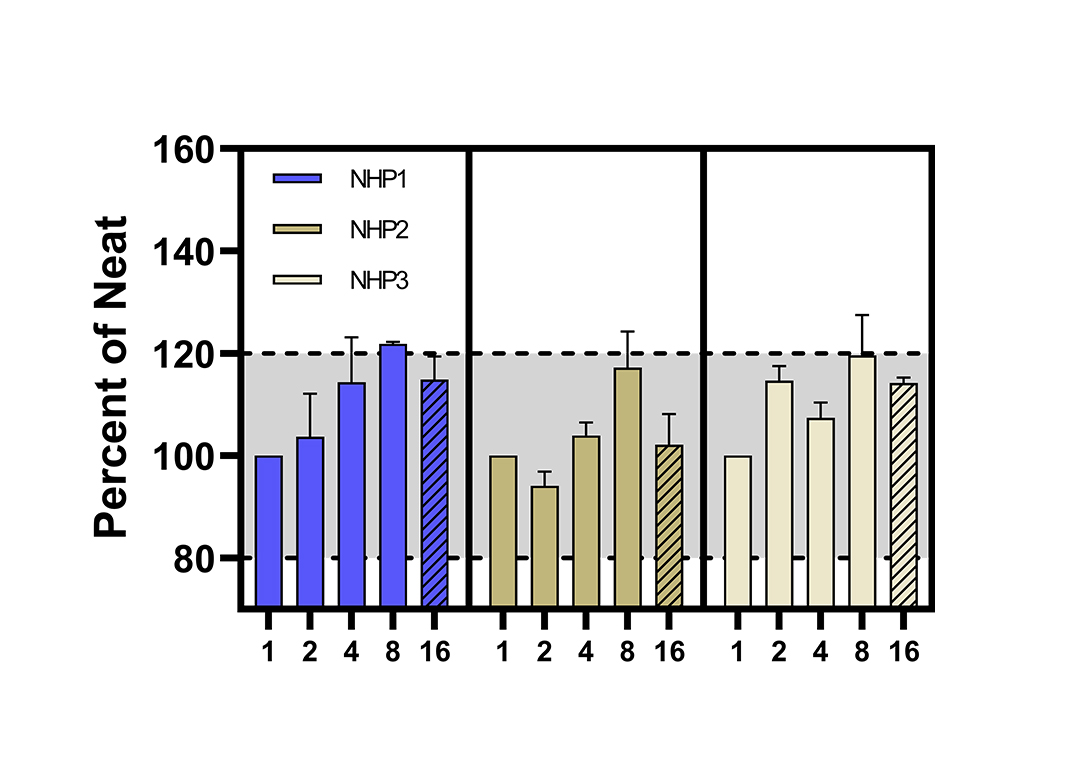
Total Human IL-15 ELISA Normal Human Serum (NHS) Parallelism (see Technical Data Sheet)
Total Human IL-15 ELISA Plasma Parallelism (see Technical Data Sheet)
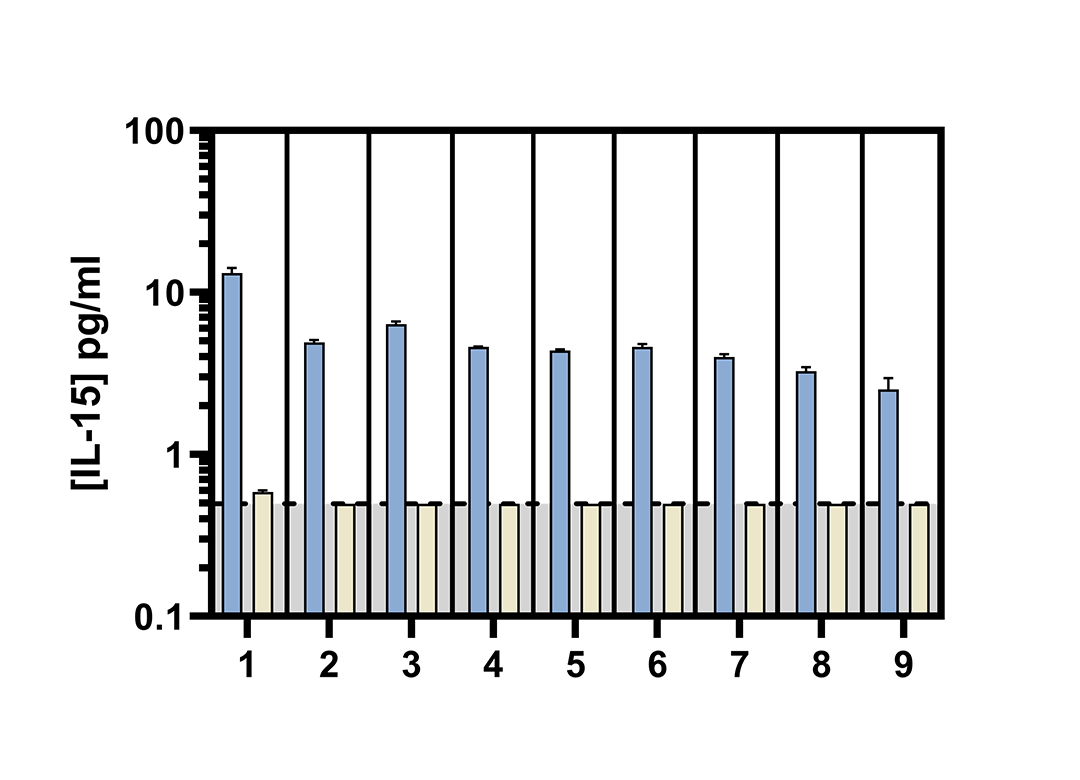
Total Human IL-15 ELISA Normal Human Serum (NHS) and Plasma Knockout (see Technical Data Sheet)
This high-sensitivity ELISA detects IL-15 and IL-15/IL-15Rα complexes in TCM, serum, and plasma. Calibrated to IL-15, it quantifies levels as low as 0.51 pg/ml in healthy donor matrices.
This kit quantitates free human IL-15 and bound IL-15/IL-15R in serum, plasma and TCM using a sandwich immunoassay. The kit is based on an ELISA with biotinylated-detection antibody and streptavidin-conjugated horseradish peroxidase (HRP). Tetramethyl-benzidine (TMB) is the substrate.
Documentation
Certificate of Analysis (CoA) & Protocol, Technical Data Sheet (TDS), and Safety Data Sheet (SDS)
Human IL-2, IL-4, IL-7, IL-9, IL-21, IFN-α, IFN-β1a, IFN-γ, IFN-ω
Cynomolgus IFN-α2
Cynomolgus/Rhesus IFN-α
Mouse IL-15, IFN-αA, IFN-β, IFN-γ
Rat IL-15, IFN-α1, IFN-α14, IFN-β, IFN-γ
Bovine IFN-τ2
Pig IFN-α
Storage
2-8 °C
Expiration Date
One year from the date of manufacture
Shipping Condition
Wet Ice
Materials Provided
Pre-Coated Micro-Titer Stripwell Plate/Sealers
Wash Solution Concentrate
Human Interleukin-15 Standard (410 pg/ml)
Assay Buffer
Dilution Buffer
Antibody Concentrate
HRP Conjugate Concentrate
Concentrate Diluent
HRP Diluent
TMB Substrate Solution
Stop Solution
Additional Materials Required (Not Provided)
Microplate reader capable of reading an OD at a wavelength of 450 nm
Variable volume microtiter pipettes
Adjustable multichannel pipette (50-300 μl)
Reagent reservoirs
Wash bottle or plate washing system
Distilled or deionized water
Serological pipettes (1, 5, 10 or 25 ml)
Disposable pipette tips (polypropylene)
Plate shaker
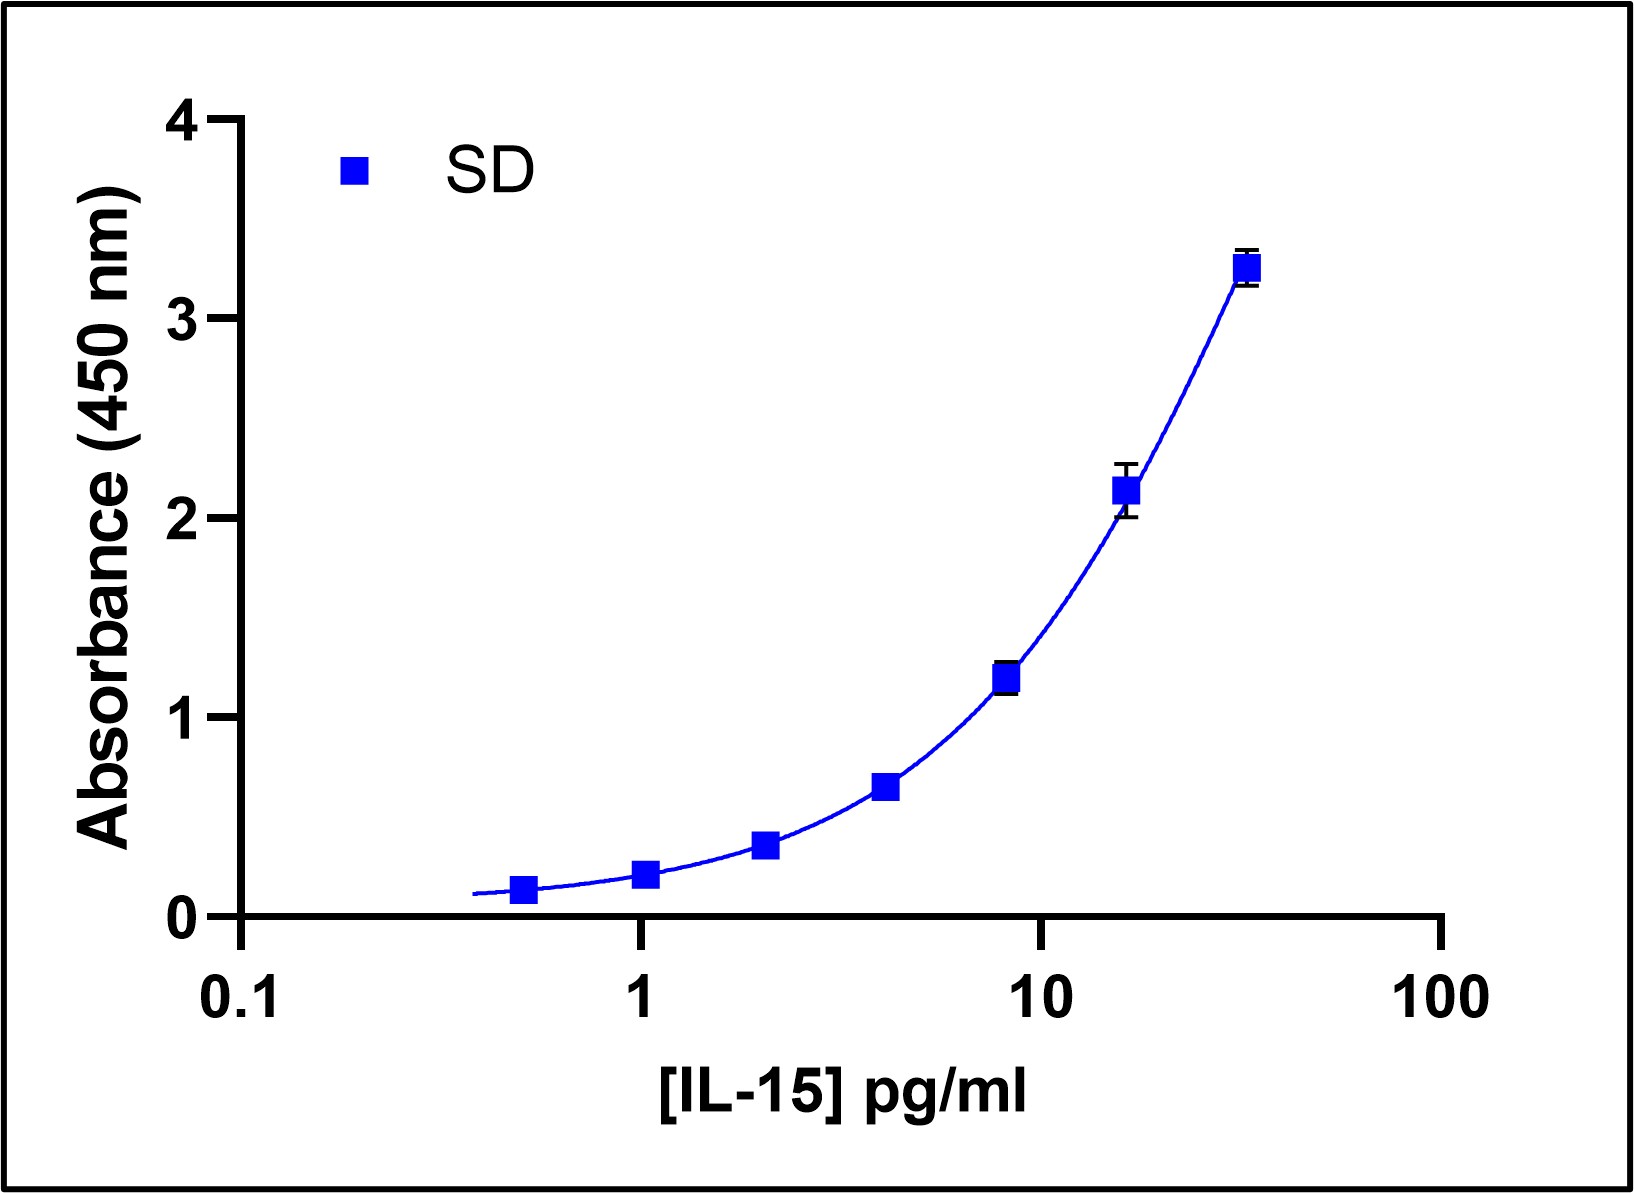
Representative Standard Curve in Standard Diluent
Human IL-15 standard curves were prepared in Standard Diluent (SD) and assayed in triplicate over 9 runs. The figure below shows dose response and absorbance values. Error bars indicate standard deviation.
Intra-Assay Precision
Sample
1
2
3
4
5
6
n
26
26
26
26
26
26
Mean (pg/ml)
4.17
4.42
4.20
2.81
3.85
3.87
Std. Dev.
0.18
0.09
0.18
0.10
0.13
0.13
CV (%)
4.4
1.9
4.3
3.6
3.3
3.3
Inter-Assay Precision
Sample
1
2
3
4
5
6
7
Mean (pg/ml)
4.52
3.55
4.47
2.87
3.54
12.55
3.68
Std. Dev.
0.24
0.16
0.17
0.16
0.19
0.61
0.13
CV (%)
5.3
4.6
3.7
5.4
5.4
4.8
3.4
Inter-Batch Precision
Sample
1
2
3
4
5
6
7
Lot 1 (pg/ml)
5.26
3.97
5.12
3.24
4.02
13.94
4.18
Lot 2 (pg/ml)
5.16
3.94
5.09
3.20
3.97
13.58
4.26
Lot 3 (pg/ml)
4.80
3.62
4.71
2.85
3.66
12.77
3.86
Mean (pg/ml)
5.07
3.84
4.97
3.10
3.88
13.43
4.10
Std. Dev.
0.24
0.19
0.22
0.21
0.20
0.60
0.21
CV(%)
4.7
5.0
4.5
6.8
5.1
4.5
5.1
Intermediate Precision
Sample
1
2
3
4
5
6
7
n
27
27
27
27
27
27
27
Mean (pg/ml)
5.07
3.84
4.97
3.10
3.88
13.43
4.05
Std. Dev.
0.63
0.49
0.57
0.38
0.45
1.30
0.40
CV (%)
12.5
12.9
11.5
12.4
11.6
9.7
9.9
Spike Recovery
TCM
Disodium-EDTA Plasma
Serum
Spike Sample
1
2
3
Target Conc. (pg/ml)
24.61
6.15
0.82
Mean Recovery
92.8
97.0
94.0
Range (%)
91.5 – 95.1
93.3 – 99.0
93.5 – 94.5
Spike Sample
1
2
3
Target Conc. (pg/ml)
24.61
6.15
0.82
Mean Recovery
98.1
99.9
82.1
Range (%)
78.4 – 104.5
85.1 – 108.1
64.9 – 95.3
Spike Sample
1
2
3
Target Conc. (pg/ml)
24.61
6.15
0.82
Mean Recovery
99.2
94.7
75.6
Range (%)
99.2
94.7
75.6
Representative Standard Curves in Various Matrices
Percent Recovery of IL-15 in Various Matrices
MDD/LOQ
Assay
1
2
3
n
80
80
80
Mean Blank (A450)
0.055
0.052
0.057
Std. Dev.
0.004
0.007
0.008
MDD (A450)
0.067
0.072
0.079
MDD (pg/ml)
0.104
0.173
0.175
LOQ (Abs450)
0.096
0.121
0.132
LOQ (pg/ml)
0.341
0.571
0.575
Linearity in Pooled Healthy Donor Serum (HDS)
Linearity in Tissue Culture Media (TCM)
Parallelism in Individual Healthy Donor Sera (HDS)
Parallelism in Healthy Donor Plasma (HDP)
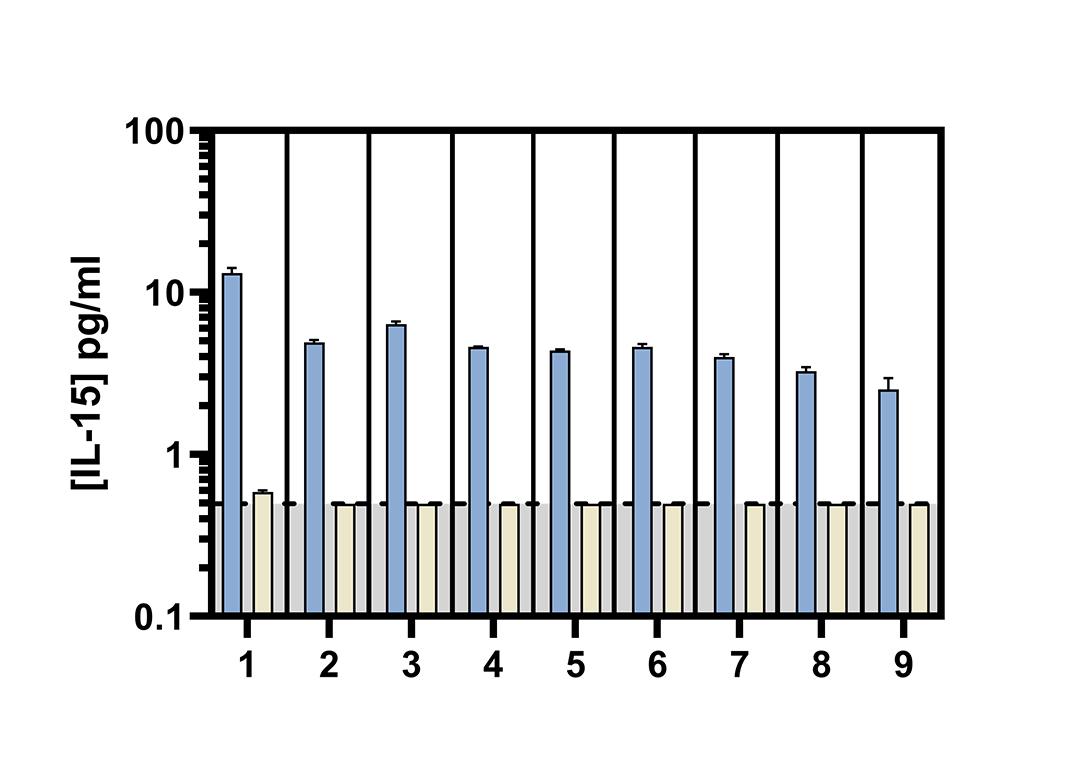
IL-15 Knockout under Control (Blue) and Specific (Beige) Conditions
Samples treated with PBL’s IL-15 specific capture antibody (beige) displayed knockdown of the observed sample concentration when compared to untreated control samples (blue). Samples treated with the specific IL-15 capture antibody recorded IL-15 levels at or below the assay LOQ.
Sample
[IL-15] pg/ml Control
[IL-15] pg/ml Specific
[IL-15] pg/ml Isotype
IL-15 Concentrations under Knockout Conditions in HDS and HDP Samples
1
13.12
0.59
6.99
2
4.92
<LOQ
4.4
3
6.38
<LOQ
3.87
4
4.61
<LOQ
4.66
5
4.38
<LOQ
4.55
6
4.61
<LOQ
4.66
7
3.98
<LOQ
3.51
8
3.27
<LOQ
2.95
9
2.52
<LOQ
2.46
Representative Standard Curves on PBL’s IL-15 ELISA (41702) and Competitors
PBL’s and three competitor’s standards were assayed on their respective ELISAs. Dose response curves and absorbance values of all IL-15 standards are shown below. PBL’s standard exhibited greater sensitivity than competitive IL-15 standards; PBL’s standard curve demonstrated an improvement of 1 – 2 log units.
Comparison of PBL’s HEK Standard on Commercial ELISAs
PBL’s HEK293 IL-15/IL-15R standard was assayed on three commercial IL-15 kits based on the suggested kit calibration range in order to investigate selectivity towards the glycosylated IL-15/IL-15R complex. Human cell-expressed IL-15 contains multiple glycosylation patterns and may be predominately expressed as a complex, as opposed to the free protein. Accurate and precise measurements may require recognition of this form of IL-155. Competitor A and C’s IL-15 ELISAs were not able to detect the glycosylated IL-15/IL-15R complex. Competitor B’s ELISA displayed an approximately 50% decrease in calibration dose response. The 41702 assay standard curve is presented for reference purposes.
Sample Type
Quantifiable Mean (pg/ml)
Range (pg/ml)
% above LOQ
% below LOQ
%CV
Healthy Donor Readability Comparison
PBL's ELISA
Competitor A's ELISA
Competitor B's ELISA
Competitor C's ELISA
Serum
4.21
2.64– 13.75
100 (30/30)
0 (0/30)
3.0
EDTA Plasma
3.01
1.75– 4.17
100
(17/17)
0
(0/17)
2.4
Citrate Plasma
2.42
1.41– 3.99
100
(13/13)
0
(0/13)
3.1
Heparin Plasma
2.63
1.62– 3.87
100
(13/13)
0
(0/13)
2.9
Serum
91.51
17.84– 244.51
30
(9/30)
70
(21/30)
30.1
EDTA Plasma
35.13
8.89– 126.25
47.1
(8/17)
52.9
(9/17)
10.7
Citrate Plasma
22.00
10.56– 38.40
46
(6/13)
54
(7/13)
14.7
Heparin Plasma
58.48
40.31-76.66
20
(2/10)
80
(8/10)
5.0
Serum
5.78
4.13– 8.11
10
(3/30)
90
(27/30)
6.1
EDTA Plasma
4.74
N/A
5.9
(1/17)
94.1
(16/17)
N/A
Citrate Plasma
N/A
N/A
0
(0/13)
100
(13/13)
N/A
Heparin Plasma
N/A
N/A
0
(0/10)
100
(10/10)
N/A
Serum
N/A
N/A
0
(0/30)
100
(30/30)
N/A
EDTA Plasma
N/A
N/A
0
(0/18)
100
(18/18)
N/A
Citrate Plasma
N/A
N/A
0
(0/12)
100
(12/12)
N/A
Heparin Plasma
N/A
N/A
100
(0/10)
0
(10/10)
N/A
Background
Interleukin-15 (IL-15) is a member of the IL-2 family of cytokines which also includes IL-4, -7, -9 and -211,2,3. It has similar and unique functions compared to IL-2. Signaling by IL-15 can be through the cytokine alone, in complex with soluble IL-15RAlpha and transpresented bound to IL15RAlpha. It is produced largely by monocytic cells but also by dendritic cells, keratinocytes, fibroblasts, myocytes, and nerve cells. It seems to enhance the expansion of CD8 memory cells, NK and NK-T cells4. IL-15 plays a role in tumor biology and autoimmune diseases including psoriasis, rheumatoid arthritis, inflammatory bowel disease, celiac disease, alopecia areata, and systemic lupus erythematosus5,6.
Human Interleukin 22 ELISA designed for accurate quantitation of endogenous human IL-22 in healthy & disease sera/plasma, and tissue culture media samples with an LLOQ of 0.78 pg/ml. This assay measures unbound (free) IL-22. IL-22 Binding Protein (IL-22BP) may interfere with the assay…
 Powered by Bioz